All published articles of this journal are available on ScienceDirect.

Evaluation of the use of Hypertonic Saline 3% Nebulizer versus Intravenous Hypertonic Saline 3% to Attenuate the Manifestations of Acute Respiratory Distress Syndrome
Abstract
Background:
A well-known disease, Acute Respiratory Distress Syndrome (ARDS) presents a daunting challenge to the medical community with alarmingly high mortality rates. Initiation of hypertonic saline (HTS) nebulization therapy for patients with early ARDS appears to be tolerable and may be beneficial. However, using a nebulizer is cumbersome and less efficient. This study aims to assess the efficacy of using HTS3% in a nebulizer in comparison with intravenously injecting it to attenuate the manifestation of ARDS. The study analyses factors such as the severity of the disease, need and duration of mechanical ventilation (MV), ICU stay, and mortality rate in the comparative analysis.
Materials and Methods:
The randomized, comparative, and controlled study included patients of both genders from an age bracket of 18-60 years. The patients fulfilled the Berlin definition of ARDS. Additionally, the whole sample was divided into four groups (26 patients each): Group A received standard pharmacotherapy [methylprednisolone 1mg/kg/day intravenously and salbutamol nebulizer 2.5 mg (1 ml) + 3 ml normal saline/8hr] and normal saline 0.9% (5ml) nebulizer /8hr: Group B received standard pharmacotherapy + HTS2.7% (5ml) nebulizer/8hr: Group C also received standard pharmacotherapy and 500ml normal saline intravenously over 24 hours: Group D received standard pharmacotherapy and 500 ml HTS 3% intravenously over 24 hours. The following parameters were recorded: Lung injury score (Murray Score, calculated every 24 hours), the incidence of the need for MV, duration of MV, length of ICU stay, and mortality rate.
Results:
Group B (HTS nebulizer group) and group D (HTS IV group) showed the most rapid improvement in the Murray score with a 50% decrease in the score from its initial value (D50%) by day 4 with P-values of 0.013 and 0.022 respectively. Subjects from Group D (HTS IV) and Group B (HTS Nebulizer) were the least in need of MV as only 38.5% needed MV with a P-value <0.001. In comparison, 69.2% subjects from group A (control) and 73.1% from group C required MV, with a P-value <0.001. The shortest duration of MV care was found in group D (median 3.12 days), followed by group B (median 4.21 days). The results were highly significant, with P-value 0.004 when compared with group A (control group) and group C. In addition, the longest duration of MV care was reported in group A (median 5.37 days). There was significant variation in all groups regarding the length of ICU stay: group D required the least number of days (median 6.76 days), followed by group B (median 7.08 days). The result was statistically significant, with a P-value of 0.004 when compared with the control group (median 9.1 days) and group C(longest duration of MV with a median of 10.13 days). However, no significant difference was found in the mortality rate (P-value >0.05).
Conclusion:
The use of hypertonic saline 3% intravenously has a comparable effect as the use of hypertonic saline 3% via nebulizer to attenuate the manifestations of (ARDS) and even superior in the mechanically ventilated patient.
1. INTRODUCTION
Acute Respiratory Distress Syndrome (ARDS) is a well-known disease) that is associated with diffuse alveolar damage followed by increased alveoli-capillary membrane permeability. This condition results in massive interstitial and alveolar edema manifested by hypoxemia and stiffness in the lungs. ARDS represents a significant proportion of patients with a prolonged hospital stay, especially ICU care, with a longer duration of mechanical ventilation. Such a scenario exhausts hospital resources while costing an exorbitant sum of money to the patients and their families. Most importantly, the disease presents a difficult challenge to the medical staff because of its high mortality rates [1].
Initiation of hypertonic saline (HTS) nebulization therapy for patients with early (ARDS) appears to be tolerable with significant improvement in oxygenation. The therapy is associated with trends to decrease mortality, ICU stay, and mechanical ventilation (MV) duration, and therefore may be added to the protective lung strategy [2].
However, using a nebulizer is cumbersome. There are also chances of carrying the infection from unsterile chambers or tubings into the lungs, especially with long term use. Furthermore, the process is associated with drug wastage, is less efficient and is also prone to electrical and mechanical breakdown [3].
The purpose of this study is to assess the effectiveness of Hypertonic Saline 3% nebulizer in comparison with the intravenous injection to attenuate the manifestation of ARDS. The study analyses factors such as severity, need and duration of mechanical ventilation, ICU stay, and mortality rate.
2. MATERIALS AND METHODS
A randomized and controlled trial having a parallel design was conducted in Ain Shams University Educational Hospitals from August 2019 till January 2020 after approval from Ain Shams University Research Ethics Committee (REC). Informed written consent was obtained from every patient or his/her first kin relative. A total of 104 patients were enrolled in the study.
2.1. Eligibility Criteria:
To be eligible, patients of both sexes had to be in the age bracket of 18-60 years. The patients' condition must also fulfill the Berlin definition of ARDS, which is as follows [4]
(1) Lung injury of acute, within 1 week of an apparent clinical insult and with progression of respiratory symptoms.
(2) Bilateral opacities on chest imaging not explained by other lung pathology (e.g. pleural effusion, pneumothorax, or nodules).
(3) Respiratory failure not explained by heart failure or volume overload.
(4) Decreased PaO2/FiO2 ratio:
(a) Mild ARDS: ratio is 201 - 300
(b) Moderate ARDS: 101 - 200
(c) Severe ARDS: ≤ 100
For each patient, the maximum duration before a medical follow-up was 14 days before the onset of ARDS symptoms. This is because the fibro-proliferative stage of ARDS starts after this period. The study did not include subjects with this stage of ARDS.
2.2. Exclusion Criteria:
(1) Presence of heart failure.
(2) Evidence of fluid overload confirmed by echocardiogram conducted on patients suspected to have left side disorder.
(3) Hypernatremic patients
(4) Patients with established final-stage renal diseases.
2.3. Procedures and Study Groups:
Regardless of the etiology (i.e. exogenous or endogenous), all eligible patients received the standard (ICU) care for ARDS patients:
(1) Standard monitoring of vital data by continuous ECG, pulse oximeter monitoring, non-invasive blood pressure monitoring (every hour or earlier), and frequent assessment of respiratory parameters.
(2) Arterial blood gases sampled at least once every day (or more if clinically indicated).
(3) A chest X-ray was conducted at least once every day.
(4) The standard pharmacotherapy of ARDS according to Ain Shams University protocol, which includes methylprednisolone 1mg/kg intravenously and salbutamol nebulizer 2.5mg (1ml + 3 ml normal saline)/8hr.
(5) Patients were ventilated with non-invasive ventilation (or invasive ventilation in case of its contraindication or failure) according to the following criteria:
- Resistant hypoxemia to FiO2 >0.6 with PaO2 <60mmHg.
- Hypercapnia PaCO2 >50mmHg or with PH <7.2
- Severe tachypnea with RR >40.
- Disturbed conscious level.
- Hemodynamic disturbance related to respiratory failure (dysrhythmias, hypotension ±30% of basal blood pressure level).
(6) The patients’ ventilator management was according to lung-protective strategy. The assessment of tolerance of weaning for mechanically ventilated patients was conducted daily, utilizing spontaneous breathing trial if feasible.
- Patients were then randomly assigned by computer-generated random sequence into four groups A, B, C & D, each group having 26 patients each:
Group A: Received the standard pharmacotherapy: Methylprednisolone 1mg/kg/day intravenously, salbutamol nebulizer 2.5mg + (1ml + 3 ml normal saline)/8hr, broad spectrum antibiotic till culture results and treatment of cause if possible + normal saline 0.9% (5ml) nebulizer /8hr.
| 1. Chest roentgenogram score | 3.PEEP score (when ventilated) | ||||
|---|---|---|---|---|---|
| No alveolar consolidation | 0 | PEEP | ≤ 5 cm H2O | 0 | |
| Alveolar consolidation confined to 1 quadrant |
1 | PEEP | 6-8 cm H2O | 1 | |
| Alveolar consolidation confined to 2 quadrant |
2 | PEEP | 9-11 cm H2O | 2 | |
| Alveolar consolidation confined to 3 quadrant |
3 | PEEP | 12-14 cm H2O | 3 | |
| Alveolar consolidation in all 4 quadrant | 4 | PEEP | ≥ 15 cm H2O | 4 | |
| 2. Hypoxemia score | 4. Respiratory system compliance score (when available) |
||||
| PaO2/FiO2 | ≥300 | 0 | Compliance | ≥80 ml/cmH2O | 0 |
| PaO2/FiO2 | 225-299 | 1 | Compliance | 60-79 ml/cmH2O | 1 |
| PaO2/FiO2 | 175-224 | 2 | Compliance | 40-59 ml/cmH2O | 2 |
| PaO2/FiO2 | 100-174 | 3 | Compliance | 20-39 ml/cmH2O | 3 |
| PaO2/FiO2 | < 100 | 4 | Compliance | ≤ 19 ml/cmH2O | 4 |
PaO2/FiO2= arterial oxygen tension to inspired oxygen concentration ratio.
PEEP = positive end-expiratory pressure.
Group B: Received the standard pharmacotherapy + hypertonic saline 3% (5ml) nebulizer /8hr.
Group C: Received the standard pharmacotherapy + normal saline intravenous 500 ml over 24 hours.
Group D: Received the standard pharmacotherapy + hypertonic saline 3% intravenous 500 ml over 24 hours.
Primary and Secondary End Points:
1. The primary endpoint was a 50% reduction in lung injury score (Murray score) from its original value (D 50%). The score was calculated every 24 hours according to the Table 1.
Secondary endpoints were:
2.Incidence of the need for mechanical ventilation.
3. Duration of mechanical ventilation (of ventilated patients).
4. Duration of ICU care.
5. ICU mortality rates.
2.4. Trial Design and Statistics:
The study was designed as a parallel trial. A sample size of 104 patients, 26 in each arm, is sufficient to detect a clinically important difference of 0.8 between groups in lung injury score assuming a standard deviation of 0.7 with 80% power and a 5% level of significance. Eligible patients were randomly assigned by simple randomization procedures by an independent researcher, using computer-generated random sequence into four treatment groups. The allocation sequence was concealed from the researchers enrolling and assessing patients in sequentially numbered, opaque, sealed, and stapled envelopes containing cards with the treatment code. Aluminum foil was put inside to render the envelope impermeable to intense light. After assessing eligibility, the patients were enrolled and grouped into the types of intervention discussed above. Afterwards, the name and date of birth of the patient were written on the envelope. Carbon paper inside the envelope transferred this information onto the allocation card inside, and it was time to open the envelope.
Preparation of the different nebulizers’ medications was performed by an independent nurse according to the treatment codes. Patients, enrolling and assessing physicians, and data analysts were kept blind to the allocation arms of the study.
The data were entered into the computer and were checked for completeness and consistency. Treatment groups were analyzed as coded. Quantitative variables were described as means and standard deviations. The LIS score was treated as a quantitative variable. Categorical variables were described as numbers and percentages. Differences between groups were tested using Analysis of Variance (ANOVA) for quantitative variables with post hoc using the Least Significant Difference (LSD) test, and Chi-square test for categorical variables. All analyses were performed on an intention-to-treat basis with a two-sided level of significance at P-value ≤ 0.05 using IBM-SPSS program version 21 (Table 2).
3. RESULTS
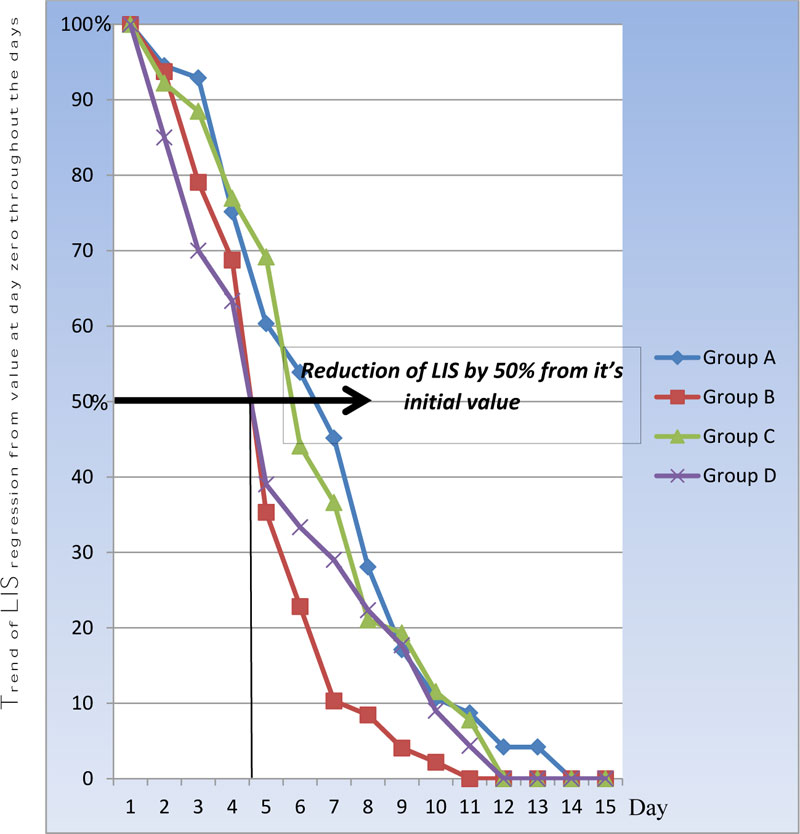
Table 3 and Fig. (1) show a statistically significant difference between groups according to the Murray score from day 1 till day 8. Days that showed a reduction in Murray score (LIS score) by >50% of its initial value (i.e. day zero) are termed as D50%. According to lung injury score (LIS), the highest score is 4 and the regression of the value corresponds to an improvement in the patient’s lung injury score. This was found to occur more rapidly in group D and group B by day 4, when compared with groups A and C. The result was statistically significant with P-value<0.001 respectively. Fig. (1) shows more rapid improvement in group D over days 1-3 than group B, while group C was in third order with D 50 % on day 5, which was statistically insignificant when compared with group A (P-value 0.62).
| Treatment Groups (number = 26 for each) | |||||
|---|---|---|---|---|---|
| A (saline N) | B (H saline N) | C (saline IV) | D (H saline IV) | P-value* | |
| Age in year (Mean ± SD) | 40.4 (6.2) | 41.3 (5.6) | 43.2 (6.1) | 39.5 (9.4) | 0.269 |
| Body weight in kg (Mean ± SD) | 81.7 (6.5) | 82.2 (5.9) | 84.4 (5.8) | 83.5 (4.6) | 0.317 |
| Male/Female | 11/15 | 14/12 | 13/13 | 16/10 | 0.572 |
Group B (H saline N): Standard pharmacotherapy + hypertonic saline 3% (5ml) nebulizer /8hr
Group C (saline IV):Standard pharmacotherapy + normal saline 0.9% (500ml) intravenous /24hr
Group D (A saline IV Standard pharmacotherapy + hypertonic saline 3% (500ml) intravenous /24hr
Abbreviations: SD: standard deviation.
* ANOVA with Least Significant Difference test was used for between-group comparisons of means and x2 test for comparison of proportions. Significance level was at P-value ≤0.05
| Study Groups (Mean ± SD) | P-values* | ||||||||||
|---|---|---|---|---|---|---|---|---|---|---|---|
| Days |
A (saline N) |
B (H saline N) |
C (saline IV) |
D (H saline IV) |
A vs B | A vs C | A vs D | B vs C | B vs D | C vs D | Overall |
| Day 0 | 3.1 ±0.72 | 3.2±0.74 | 3.47±0.63 | 3.0±0.69 | 0.094 | ||||||
| Day 1 | 2.93±0.58 | 3.00±0.53 | 3.20±0.76 | 2.55±0.73 | 0.651 | 0.156 | 0.042* | 0.276 | 0.014* | 0.003* | 0.006* |
| Day2 | 2.88±0.91 | 2.53±1.11 | 3.07±0.87 | 2.10±1.07 | 0.219 | 0.445 | 0.007* | 0.056 | 0.161 | <0.001 | 0.004* |
| Day 3 | 2.33±1.27 | 2.1 ±1.10 | 2.67±0.88 | 1.80±1.06 | 0.488 | 0.267 | 0.108 | 0.044* | 0.321 | 0.002* | 0.035* |
| Day 4 | 1.87±1.15 | 1.13±1.04 | 2.40±1.16 | 1.07±0.94 | 0.019* | 0.104 | 0.008* | <0.001 | 0.828 | <0.001 | <0.001 |
| Day 5 | 1.67±1.08 | 0.73±1.01 | 1.53±1.17 | 1.00±0.89 | 0.002* | 0.655 | 0.018* | 0.011* | 0.311 | 0.072 | 0.004* |
| Day 6 | 1.40±1.15 | 0.33±0.71 | 1.27±1.26 | 0.87±0.71 | <0.001 | 0.699 | 0.050* | <0.001 | 0.008* | 0.165 | <0.001 |
| Day 7 | 0.87±0.90 | 0.27±0.58 | 0.73±0.87 | 0.67±0.69 | 0.006* | 0.571 | 0.372 | 0.029* | 0.028* | 0.784 | 0.039* |
| Day 8 | 0.53±0.73 | 0.46±0.31 | 0.67±0.88 | 0.23±0.35 | 0.654 | 0.535 | 0.064 | 0.256 | 0.015* | 0.022* | 0.013* |
| Day 9 | 0.33±0.61 | 0.27±0.17 | 0.40±0.72 | 0.16±0.41 | 0.082 | ||||||
| Day 10 | 0.27±0.58 | 0.15±0.11 | 0.37±0.45 | 0.11±0.10 | 0.057 | ||||||
| Day 11 | 0.13±0.51 | 0.00±0.00 | 0.00±0.00 | 0.00±0.00 | 0.096 | ||||||
| Day 12 | 0.13±0.51 | 0.00±0.00 | 0.00±0.00 | 0.00±0.00 | 0.096 | ||||||
| Day 13 | 0.00±0.00 | 0.00±0.00 | 0.00±0.00 | 0.00±0.00 | 1.000 | ||||||
| Day 14 | 0.00±0.00 | 0.00±0.00 | 0.00±0.00 | 0.00±0.00 | 1.000 | ||||||
| ICU Days | 9.60±4.10 | 6.87±2.85 | 10.13±3.56 | 7.07±4.21 | 0.007* | 0.620 | 0.033* | <0.001 | 0.841 | 0.006* | 0.002* |
| Need for Mechanical Ventilation: Number (%)** | A vs B | A vs C | A vs D | B vs C | B vs D | C vs D | |||||
| No need | 19 (73.1) | 10 (38.5) | 18 (69.2) | 10 (38.5) | 0.012* | 0.760 | 0.012* | 0.026* | 1.000 | 0.026* | |
| Non-Inv. | 5 (19.2) | 3 (11.5) | 7 (26.9) | 6 (23.1) | 0.442 | 0.510 | 0.734 | 0.159 | 0.271 | 0.749 | |
| Inv. | 14 (53.8) | 7 (26.9) | 11 (42.3) | 4 (15.4) | 0.048* | 0.405 | 0.004* | 0.244 | 0.308 | 0.032* | |
Group B(H saline N): Standard pharmacotherapy + hypertonic saline 3% (5ml) nebulizer /8hr
Group C(saline IV):Standard pharmacotherapy + normal saline 0.9% (500ml) intravenous /24hr
Group D(H saline IV Standard pharmacotherapy + hypertonic saline 3% (500ml) intravenous /24hr
Abbreviations: SD: standard deviation. .
* ANOVA with Least Significant Difference test was used for between-group comparisons of means and x2 test for comparison of proportions.
Significance level was at P-value ≤0.05** Percentages were taken out of 26 (the group total).
background shade (D50%):mean reduction of score to half of baseline values
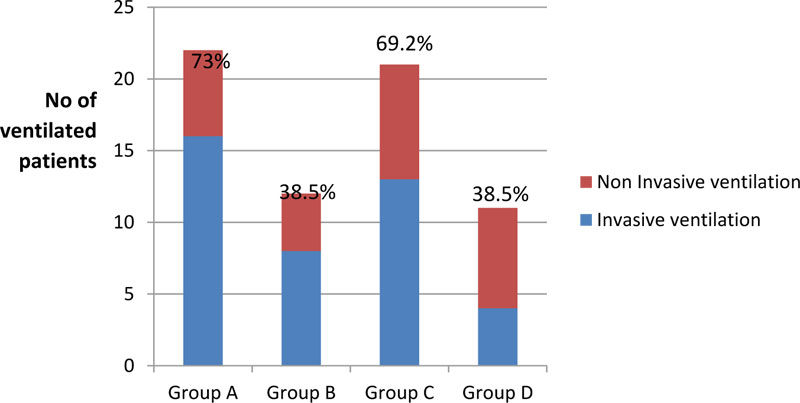
Table 3 and Fig. (2) show a statistically significant difference between groups according to the need for mechanical ventilation. Groups D and B needed mechanical ventilation the least as only 38.5% of the patients required it, with P-value <0.001 when it was compared with group A (control) (73.1%) and group C (69.2%). Moreover, group D required invasive ventilation the least as only 15.4% required invasive ventilation, a statistically significant result when compared with group C with a p-value <0.001.
Group B(H saline N): Standard pharmacotherapy + hypertonic saline 3% (5ml) nebulizer /8hr
Group C(saline IV):Standard pharmacotherapy + normal saline 0.9% (500ml) intravenous /24hr
Group D(H saline IV): Standard pharmacotherapy + hypertonic saline 3% (500ml) intravenous /24hr. Difference chart between groups according to the Murray score.
Group B(H saline N): Standard pharmacotherapy + hypertonic saline 3% (5ml) nebulizer /8hr.
Group C(saline IV):Standard pharmacotherapy + normal saline 0.9% (500ml) intravenous /24hr.
Group B(H saline IV): Standard pharmacotherapy + hypertonic saline 3% (500ml) intravenous /24hr. Bar chart between groups according to the need for mechanical ventilation.
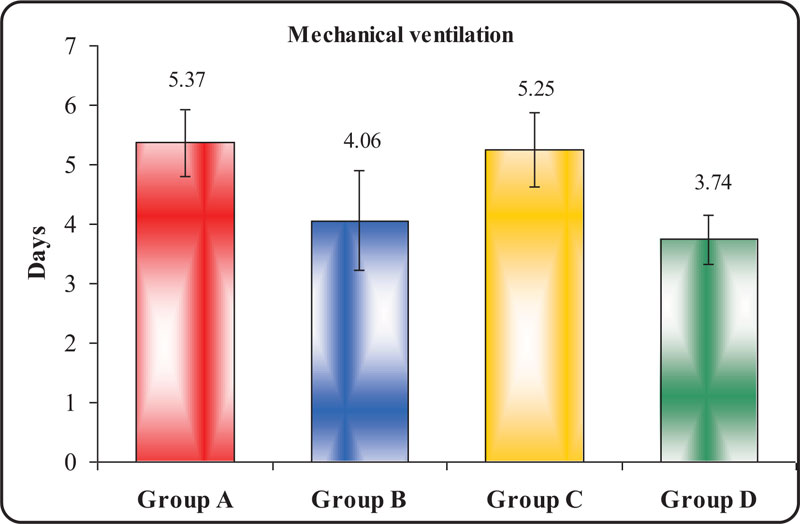
Table 4 and Fig. (3) display a statistically significant difference between groups according to the duration of mechanical ventilation. The shortest duration of Mechanical Ventilation (MV) was observed in group D, followed by group B, with a median of 3.12 and 4.21 days respectively. The result was highly statistically significant with a P-value of 0.004 when compared with MV duration in group A (control) and group C. The longest duration of MV was observed in group A with a median of 5.37 days. However, this result was statistically insignificant, with a p-value of 0.467 when compared with group C.
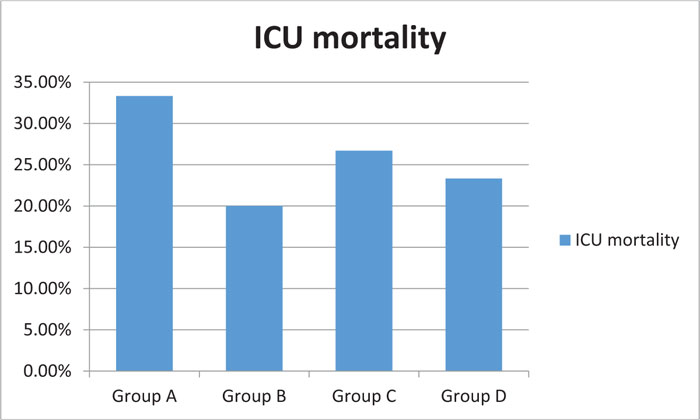
Fig. (4) shows a statistically insignificant difference between groups regarding the mortality rate. Group B had the least fatalities in the ICU, followed by group D. The highest mortality rate was observed in group A, though with a p-value >0.05.
Table 5 Shows a statistically significant difference between the groups according to ICU duration. Again, the shortest period of duration was observed in group D, followed by group B. The longest duration was observed in group C, followed by group A, with a p-value<0.001.
Group B(H saline N): Standard pharmacotherapy + hypertonic saline 3% (5ml) nebulizer /8hr
Group C((saline IV):Standard pharmacotherapy + normal saline 0.9% (500ml) intravenous /24hr
Group D(H saline IV?): Standard pharmacotherapy + hypertonic saline 3% (500ml) intravenous /24hr
Bar chart between groups according to duration of mechanical ventilation.
| Groups | Days of Mechanical Ventilation | ANOVA | |||||||||||
|---|---|---|---|---|---|---|---|---|---|---|---|---|---|
| Range | Mean | ± | SD | F | P-value | ||||||||
| Group A | 5 | 6 | 5.37 | 0.56 | 4.736 | 0.004* | |||||||
| Group B | 4 | 5 | 4.26 | 0.43 | |||||||||
| Group C | 5 | 6 | 5.25 | 0.62 | |||||||||
| Group D | 3 | 4 | 3.12 | 4.81 | |||||||||
| Tukey's test | |||||||||||||
| A & B | A & C | A & D | B & C | B & D | C & D | ||||||||
| <0.001** | 0.467 | <0.001** | <0.001** | <0.001** | 0.234 | ||||||||
Group B(H saline N): Standard pharmacotherapy + hypertonic saline 3% (5ml) nebulizer /8hr.
Group C((saline IV):Standard pharmacotherapy + normal saline 0.9% (500ml) intravenous /24hr.
Group D(H saline IV): Standard pharmacotherapy + hypertonic saline 3% (500ml) intravenous /24hr.
Arrows show groups with a statistically significant reduction in the duration of mechanical ventilation.
| Groups | ICU days | ANOVA | |||||||
|---|---|---|---|---|---|---|---|---|---|
| Mean | ± | SD | f | P-value | |||||
| Group A | 9.60 | ± | 3.10 | 6.886 | <0.001** | ||||
| Group B | 7.08 | ± | 4.21 | ||||||
| Group C | 10.13 | ± | 3.56 | ||||||
| Group D | 6.76 | ± | 2.15 | ||||||
| Tukey's test | |||||||||
| A & B | A & C | A & D | B & C | B & D | C & D | ||||
| 0.018* | 0.569 | <0.001** | 0.007* | 0.731 | <0.001** | ||||
Group B(H saline N): Standard pharmacotherapy + hypertonic saline 3% (5ml) nebulizer /8hr
Group C(saline IV):Standard pharmacotherapy + normal saline 0.9% (500ml) intravenous /24hr
Group D((H saline IV Standard pharmacotherapy + hypertonic saline 3% (500ml) intravenous /24hr
Group B(H saline N): Standard pharmacotherapy + hypertonic saline 3% (5ml) nebulizer /8hr.
Group C((saline IV):Standard pharmacotherapy + normal saline 0.9% (500ml) intravenous /24hr .
Group D((H saline IV) Standard pharmacotherapy + hypertonic saline 3% (500ml) intravenous /24hr.
Bar chart between groups displaying the mortality rates.
4. DISCUSSION
This study analyzes the efficacy of HTS administered through a nebulizer, comparing it with intravenously injecting it to attenuate the manifestation of ARDS. 104 patients were included in this study, according to the set eligibility criteria discussed above. The patients were then randomly divided into four groups. Each group had both endogenous and exogenous cases of ARDS, including pneumonia (bacterial or viral), septicemia, pancreatitis, aspiration, lung contusion, etc.
Group D (HTS IV) and Group B (HTS via N) showed the most rapid improvement in Murray score with a decrease of 50% of its initial value (D50%) by day 4 with P-value 0.013 and 0.022 respectively. Although group C (Saline IV) took 5 days to exhibit a decrease of less than 50% of its initial value (D50%), it was a statistically insignificant rate of improvement when compared with control group A (normal saline via N), which showed a 50% decline in Murray score by day 6 with P-value >0.05. This finding is consistent with the results obtained by Tayseeret et al. [2]. Their results found significant improvement in the hypoxic index throughout the seven days of their study. Their sample included 60 patients categorized into two groups: group I (control group) included thirty patients, while group II (study group) included thirty patients who received one dose 4ml of hypertonic saline nebulization daily for 7 days. In comparison with the control group, a significant increase in the hypoxic index was observed every day after hypertonic saline was administered to the patients. Moreover, a statistically significant increase was observed in the hypoxic index from day 4 till day 7 in comparison to day 1 in the study group at the 1st reading.
Suchitra and Nagaveni [6] investigated the effects of nebulized HTS in the treatment of hospitalized infants with viral bronchiolitis on the respiratory epithelium and the mucociliary transport. The study demonstrated that the duration of hospital stay in cases treated with 3% HTS group showed a 25% reduction, compared to a 0.9% reduction with the NS group.
Animal studies carried out by Wohlauer and colleagues [7] demonstrated that inhaled hypertonic saline attenuates post-shock acute lung injury by having an anti-inflammatory effect on the pulmonary epithelium. Kennedy and colleagues [8] found that HTS reduces pulmonary inflammation and enhances the resolution of oleic acid-induced lung injury in rats.
In agreement with our study, Kellett et al. [9] in a long-term trial studied the effectiveness of hypertonic saline nebulization on long-term infection rate, quality of life, and lung function in patients with stable bronchiectasis. Riedler and colleagues [10] investigated the effects of nebulized HS in cystic fibrosis (CF) to reduce the frequency of pulmonary exacerbations. Their results also indicated that nebulized HS has minor effects on improvement in the quality of life in adults.
Regarding the need for supportive mechanical ventilation (MV), the study concluded that group D (HTS IV) and group B (HTS nebulizer) required MV the least, with only 38.5% of the patients in these groups requiring MV. The p-value was 0.026 when compared with 69% of the patients in group C (N. Saline IV) and 73.1% of the patients in group A (N. Saline Nebulizer) requiring MV care with fewer days of mechanical ventilation with median value three days that was statistically significant with p-value <0.001 when compared with group C.
These findings can be attributed to the use of HTS nebulizer in group B and IV in group D as both groups showed around 50% reduction in the need for mechanical ventilation. We can conclude that HTS nebulizer and IV have a temporizing effect against disease progression, giving more time to the lungs to heal. primarily by time as the most important issue of ARDS treatment is targeted against insulting factor not the disease itself as well as avoiding various side effects of ventilation from barotrauma, volumtrauma, biotrauma and most importantly ventilator associated pneumonia (VAP) and its sequelae up to death from VAP not ARDS itself especially those with mild form of disease that can withstands by oxygen supplementation without any iatrogenic complications of ventilation and just are waiting for treatment of the cause.
Deleterious effects of mechanical ventilation in ARDS patients were evaluated by Delclaux et al [11]. The researchers performed a prospective study of lower respiratory tract colonization and infection in 30 ventilated patients with severe ARDS by repeated quantitative culture of plugged telescoping catheter specimens every 48–72 h after the development of ARDS. Using clinical and microbiological criteria, the re searchers found an incidence of VAP of 60%. Meduri et al.[12] found that 43% of patients with ARDS in their study had VAP using bilateral bronchoalveolar lavage. However, the prolonged duration of mechanical ventilation for patients with ARDS may be more important in predisposing them to VAP than ARDS itself.
There was significant variation in all groups regarding the length of ICU stay (P-value <0.05), with a mean range of 6.76 in group D (HTS IV) and group B (HTS Nebulizer), 7.08 to 9 days in group A (Saline N. Nebulizer) and an even longer ICU stay in group C (Saline NIV) with the median stay between 9 and 10 days. This can be explained by all the previously discussed factors, ranging from slower improvement in LIS, longer duration of ventilation, development of secondary complications such as VAP. Moreover, causes other than ARDS, such as various organ dysfunctions also resulted in a longer ICU stay.
Lastly, no significant reduction was observed in the mortality rate of group B (HTS Nebulizer). Group B had an ICU mortality rate of 20%, compared to the 23% in group D, 26% in group C, and 33.3% in group A. This indicated that the results were statistically insignificant with p-value >0.05. This finding was consistent with the results of a study carried out by an ARDS net group in 2006. The study randomly assigned 180 patients with ARDS to two groups; one group received methylprednisolone while the other received a placebo in a double-blind fashion. The treatment lasted for seven days. No significant difference was recorded in the 60-day hospital mortality rate, as 26 deaths were recorded in each group. To be exact, the figures were 28.6% (95 percent confidence interval) for the placebo group and 29.2% (95% confidence interval) for the methylprednisolone group, for an absolute difference of 0.6%) [13].
Tayseeret et al. [2] found in their study that 28th-day mortality the survival was more common in the hypertonic saline group as compared to the control group with a statistically significant difference between the two groups (p=0.001).
Majority of the patients died from multiple organ dysfunction syndrome (MODS) and septic shock, except for 8 patients (two in each group) that died early during the course of the disease i.e. within the first 48 hours from diagnosis. This occurred due to resistant hypoxemia despite all ventilatory measures to improve oxygenation. and non-accessibility of facility supported with extra corporal membrane oxygenator (ECMO) in our institution. The patients that died from MODS were found to fall into either of the following categories:
1. Systemic inflammatory response syndrome (SIRS) related to primary illness (insulting factor that triggered ARDS e.g. pancreatitis, peritonitis, etc).
2. SIRS related to ventilator acquired pneumonia from most popular pathogens: acintobacterbumenii, Kebsiella (ESBL), and occasionally pseudomonas aerogenosa (i.e. multi-drug resistant organism).
It is believed that the beneficial effects of inhaled drugs are fewer in patients on MV than in those breathing spontaneously. In an earlier study, only 2.9% of the administered dose reached the distal airway (vs. 11.9% when the dose was administered without an artificial airway). This might be due to a substantial drug loss caused by the turbulent flow by the respiratory prosthesis [14]. This explains why group D required the least mechanical ventilation (mean 3.7 days) as compared to group B (mean 4.21 days).
Many factors influence nebulizer efficiency during mechanical ventilation, including the type of nebulizer, residual volume, mode of nebulization, the position of the nebulizer in the ventilator circuit, gas flow, and bias flow [15].
The disadvantages of conventional nebulizers include the need for an external flow source independent of the ventilator, the need to install the equipment, and the need for thorough cleaning. Ultrasonic nebulizers can provide a higher nebulization rate in a shorter time period. However, their availability is limited because of its high cost [16].
To date, only low-tidal volume ventilation using a lung-protective approach has demonstrated a clear benefit in improving the survival of patients with ARDS. It is also becoming increasingly clear that a combination of interventions is more likely to succeed rather than just one intervention applied in isolation.
CONCLUSION
The use of hypertonic saline 3% intravenously has comparable effect as the use of hypertonic saline 3% nebulizer to attenuate the manifestation of ARDS and even superior in mechanically ventilated patient.
ETHICAL APPROVAL AND CONSENT TO PARTICIPATE
This study was approved by Ain Shams University Research Ethics Committee (REC) FWA000017585.FMASU 50/2019.
HUMAN AND ANIMAL RIGHTS
No Animals were used in this research. All human research procedures followed were in accordance with the ethical standards of the committee responsible for human experimentation (institutional and national), and with the Helsinki Declaration of 1975, as revised in 2013.
CONSENT FOR PUBLICATION
Informed written consent was obtained from every patient or his/her first kin relative.
STANDARDS FOR REPORTING
CONSORT guidelines and methodology were followed.
FUNDING
None.
CONFLICTS OF INTEREST
The author declares no conflict of interest, financial or otherwise.
ACKNOWLEDGEMENTS
Declared none.