All published articles of this journal are available on ScienceDirect.

Correlation of Different Time Measurements of the Surgical Pleth Index with Postoperative Pain: A Prospective Observational Study
Authors Info & Affiliations
Abstract
Background
The Surgical Pleth Index (SPI) has been introduced to monitor intraoperative pain under general anesthesia. This study aimed to determine the optimum time to measure intraoperative SPI, which correlates better with postoperative pain.
Methods
This prospective blind study collected data from female patients scheduled for elective abdominal hysterectomy under general anesthesia. SPI was recorded 5 minutes after the skin incision and 10 minutes before recovery. After recovery, upon the ability to communicate, all patients were asked to quantify their pain level. The primary outcome was determining which SPI measurement correlates more with postoperative pain.
Results
In the current study, we found a statistically significant correlation between SPI 10 min before recovery and the highest NRS (r=0.555, p-value <0.001). With the highest sensitivity and specificity, the cut-off value of SPI at 10 minutes before recovery to differentiate between moderate and severe pain was 57. On the other hand, no significant correlation was observed between SPI 5 min after skin incision and the highest NRS. Also, SPI 10 at minutes was significantly correlated with postoperative tramadol consumption, which was unlike SPI at 5 minutes.
Conclusion
SPI is a good indicator for nociception. Pre-arousal SPI score correlates more with postoperative pain scores and opioid consumption than SPI score after skin incision. Also, SPI 10 minutes before recovery value of 57 was the cut-off value, with the highest sensitivity and specificity, to differentiate between moderate and severe pain.
Clinical Trial Registration Number
The study was conducted after registration on ClinicalTrials.gov (NCT 04724564; principal investigator: Mohamed Ahmed Hamed; date of registration: January 26, 2021).
1. INTRODUCTION
Despite the significant progress in anesthetic techniques, postoperative pain is still considered a major problem during practice [1]. One to two-thirds of patients will suffer postoperative pain, leading to many co-morbidities. These co-morbidities can include pulmonary complications, cardiac complications, and delirium [2]. Numerous risk factors are associated with the emergence of postoperative pain, including younger age, female sex, preoperative pain, and extensive surgical procedures. In addition, the severity of postoperative pain may vary among patients undergoing the same operation [3].
Many techniques have been evolved to monitor nociception and predict postoperative pain intensity; one of the most recent techniques is the surgical pleth index (SPI) [4]. SPI is a non-invasive dimensionless score; its value is obtained from heartbeat intervals and pulse wave amplitude monitored by a pulse oximetry probe. SPI reflects the sympathetic response of the patient to the surgical stimuli [5, 6]. It was reported that SPI is better than other parameters like heart rate and blood pressure for detecting the balance between nociceptor activation and analgesia [7], and its value is correlated with the severity of postoperative pain. SPI values range from 0 to 100, and higher values indicate a strong surgical stimulus [8]. SPI can be used as a guide for intraoperative analgesia; hence, it can be a valuable tool to assess the analgesic requirement and limit opioid consumption, both preoperative and postoperative [9].
Several studies have been performed to predict the severity of postoperative pain using SPI in adults and children [10]. It was also used successfully to expect a hemodynamic response to tracheal intubation and skin incision and to monitor nerve block success [11].
However, since SPI emerged, the most sensitive cut-off value that correlates well with postoperative pain severity remained debatable. Recent studies reported a value of 30 as a cut-off value of SPI [12]. On the other hand, the time of measurement to rely on was debatable. Most studies recommended that a measure of SPI before recovery can be used. However, a recent study suggested that SPI response to surgical incisions correlates highly with postoperative pain and opioid consumption [10]. Based on these data, we hypothesized that both measurements are correlated with postoperative pain and aimed to test which measure is more correlated. Hence, the current study evaluates the optimum time to measure intraoperative SPI, which correlates better with postoperative pain.
2. METHODS
This prospective observational study was conducted following the tenets of the Declaration of Helsinki. The ethical review board approved the study design of Fayoum University Hospital (M 703), and the eligible participants signed a detailed informed consent. The study was conducted after registration on ClinicalTrials.gov (NCT 04724564; principal investigator: Mohamed Ahmed Hamed; date of registration: January 26, 2021). This study adheres to the applicable CONSORT guidelines.
In this prospective observational study, 99 female patients were scheduled for elective abdominal hysterectomy under general anesthesia at Fayoum University Hospital from February 2021 to December 2021.
The exclusion criteria were female patients with significant dysrhythmia like AF or atrioventricular block of more than one degree, patients with a pacemaker, patients who had vasoactive medications, and any intraoperative treatment with clonidine, beta-receptor agonists or antagonists, or any other drug that can affect the sympathovagal balance. Patients receiving neuraxial anesthesia were also excluded.
2.1. Anesthetic Technique and Pain Management
All patients were preoperatively examined and investigated as routine hospital practice, and a pre-anesthetic assessment was performed.
All patients fasted for 6 hours for solid food and 2 hours for clear fluids before the operation. After arriving at the operating room, standard monitoring (Pulse oximetry, Non-invasive blood pressure, and Electro- cardiogram) was applied and continued throughout the procedure. An 18G peripheral cannula was inserted. All patients were pre-oxygenated with 100% O2 and premedicated with 0.03 mg/kg IV midazolam and 10 mg metoclopramide. Intravenous induction of anesthesia was performed using 2mg/kg propofol, 2µgm/kg fentanyl, and 0.5mg/kg atracurium. All patients received 1gm paracetamol IV as intraoperative supplementary analgesia just after the induction. An endotracheal tube was inserted for all patients. Mechanical ventilation was adjusted as volume-controlled ventilation with 5cm H2O aiming to maintain end-tidal Co2 pressure of 30 to 40 mmHg by a mixture of O2 /air with fiO2 0.5. Anesthesia was maintained with isoflurane 1 MAC. SPI was recorded 5 min after skin incision and 10 min before recovery using anesthesia machine (carestation 650 l GE.3.4.2019).
After recovery (state of consciousness of an individual when he is awake or easily arousable and aware of his surroundings and identity), upon the ability to commu- nicate, all patients were asked to quantify their level of pain on a 0 – 10 point numeric rating scale (NRS) with (0= no pain, 1-3 mild, 4-5 moderate and 6-10 severe). Three scores were obtained at 5-minute intervals, and the highest pain score of the three was recorded for further analysis (without affection of the routine pain management).
All patients were transferred to the obstetrics ward when they reached a modified Aldrete score ≥9. During the first 24 hours, all patients received IV paracetamol 1 g every 8 hours for postoperative analgesia according to the obstetric department protocol. In addition to intravenous tramadol through PCA (concentration of 4 mg/ml) with 20 mg dose, 10 minutes lockout interval, and one one-hour limit of 50 mg, if the patient experienced high SPI intraoperative or in the PACU once the patient reported high VAS-pain score, supplement analgesics dose of IV paracetamol 1 g was administered.
2.2. Measured Parameters
The measured parameters were as follows: SPI at 5 minutes after skin incision and 10 minutes before recovery, the highest pain score (NRS) in the PACU, total tramadol consumption during the first 24 hours, nausea and vomiting (were assessed on a scale: 0 = no symptoms, 1 = only Nausea, 2 = Nausea and/vomiting), respiratory depression (defined as respiratory rate lower than 10), and sedation (assessed using a sedation score where 0 = awake and alert, 1 = quietly awake, 2 = asleep but easily arousable, 3=deep sleep, responding to a painful stimulus)
All these data were collected by a separate anesthesiologist who was blinded to the study.
The primary outcome was determining which SPI measurement correlates more with postoperative pain. The secondary outcomes were to evaluate the correlation between the SPI measurements and tramadol consumption in the first postoperative 24 hours and to define the cut-off value of SPI measurements.
2.3. Statistical Analysis
2.3.1. Sample Size
The sample size was calculated using MedCalc software version 20. To identify the discriminative power of SPI in predicting severe postoperative pain, an AUC of 0.685 was assumed (based on the results of a pilot study of 10 patients), with an alpha error of 0.05, power of 90%, a case to control ratio of 1:1, and a total sample size of 99.
2.3.2. Statistical Methods
Descriptive statistics are presented as minimum, maximum, mean, and standard deviation for numerical variables, while numbers and percentages are used for categorical variables. Pearson's correlation studied the correlation between SPI 5 minutes after incision, 10 minutes before recovery, and the highest NRS and tramadol dose. Simple linear regression was used to study the association between SPI 10 min and the highest NRS and tramadol dose outcomes. An independent samples t-test was used to compare the SPI scores of patients with nausea and those with no symptoms.
IBM SPSS 28 for Windows software was used for the analysis, and a P-value ≤ 0.05 was considered statistically significant.
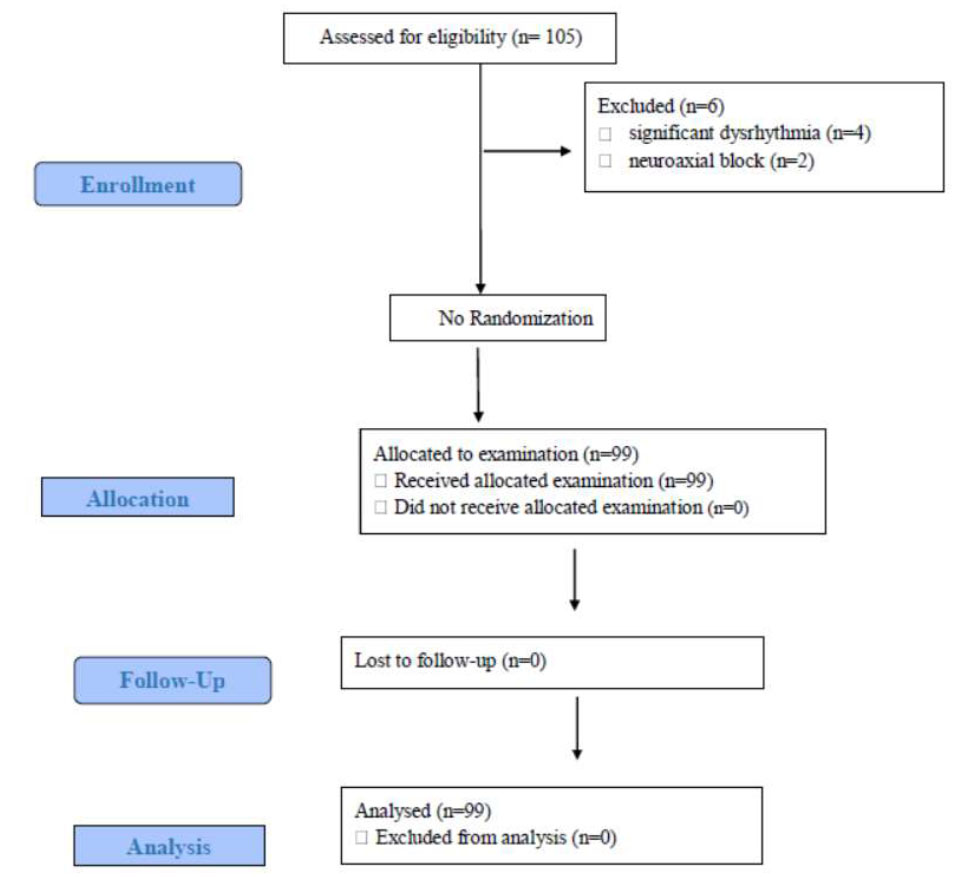
Consort flow diagram of the study population.
Abbreviation: n, number.
3. RESULTS
For this study, 105 patients were assessed for eligibility based on the inclusion and exclusion criteria. Six patients were excluded, 4 patients had significant dysrhythmia intraoperatively, and two received neuraxial block. The remaining 99 patients were allocated for examination, and 99 patients received the assigned study (Fig. 1).
There was no statistically significant difference in the demographic characteristics.
Correlation between SPI 5 min after incision, 10 min before recovery, and highest NRS and tramadol dose were studied using Pearson's correlation; No significant correlation was observed between SPI 5 min and the highest NRS or tramadol dose. On the other hand, there was a statistically significant correlation between SPI 10 min before recovery and the highest NRS (r=0.555, p-value <0.001) and a significant correlation with tramadol dose (r= 0.488, p-value <0.001). In the two cases, there was a moderate positive correlation (Table 1).
Simple linear regression was used to study the association between SPI 10 min and the highest NRS and tramadol dose outcomes. Age and BMI were excluded from the model as they were not statistically associated with the outcomes.
For each unit increase in the SPI 10 min, an expected increase in the highest NRS score was by an average of 0.06 (95% CI: 0.04, 0.08) (Table 2).
The expected highest NRS score can be predicted from the equation: highest NRS= 3.96 + (0.06* SPI 10 min). The expected tramadol dose can be predicted from the equation: tramadol dose= 12.47 + (3.29* SPI 10 min).
An independent samples t-test was used to compare the SPI scores of patients with nausea and those with no symptoms. There was no statistically significant difference between them regarding SPI 5 min. However, SPI 10 min was associated with the occurrence of nausea. SPI 10 min was higher in patients who had nausea (mean =68.88 ± 10.24) as compared to those who had no symptoms (mean = 58.68±10.72), p-value < 0.001 (Table 3).
None of the patients suffered from respiratory dep- ression. Forty patients, representing 40.4%, had nausea, and no patients had vomiting. About 58.6% were awake and alert for the sedation level, while 41.4% were quietly awake.
| - | SPI 5 Minute | SPI 10 Minute | Highest NRS | Tramadol Dose(mg) | |
|---|---|---|---|---|---|
| SPI 5 minute | Pearson Correlation coefficient | -- | - | - | - |
| SPI 10 minute | Pearson Correlation coefficient | 0.165 | -- | - | - |
| P-value | 0.102 | - | - | - | |
| Highest NRS | Pearson Correlation coefficient | 0.166 | 0.555 | -- | - |
| P-value | 0.100 | <0.001 | - | - | |
| Tramadol dose (mg) | Pearson Correlation coefficient | 0.113 | 0.488 | 0.903 | -- |
| P-value | 0.265 | <0.001 | <0.001 | - | |
| Model | Coefficients | p-value | 95% Confidence Interval for Coefficients | R squared | ||
|---|---|---|---|---|---|---|
| Lower Bound | Upper Bound | |||||
| Highest NRS | Constant | 3.96 | <0.001 | 2.78 | 5.14 | 0.308 |
| SPI 10 minute | 0.06 | <0.001 | 0.04 | 0.08 | ||
| Tramadol dose(mg) | Constant | 12.47 | 0.744 | -63.21 | 88.15 | 0.238 |
| SPI 10 minute | 3.29 | <0.001 | 2.10 | 4.47 | ||
| - | N | Mean | SD | p-value | |
|---|---|---|---|---|---|
| SPI 5 min | No symptoms | 59 | 32.22 | 6.80 | 0.278 |
| Nausea | 40 | 33.70 | 6.36 | ||
| SPI 10 min | No symptoms | 59 | 58.68 | 10.72 | <0.001 |
| Nausea | 40 | 68.88 | 10.24 | ||

ROC curve to differentiate between moderate Pain (NRS 4-5) and severe pain (NRS 6-10) using SPI 10 min.
Abbreviations: SPI, Surgical Pleth Index.
A receiver operating characteristic curve (ROC) was used to differentiate between moderate Pain (NRS 4-5) and severe pain (NRS 6-10) using SPI 10 min. The cut-off value, with the highest sensitivity of 66.32% (95%CI: 55.9 - 75.7) and specificity of 100% (95% CI: 39.8-100), of SPI 10 minutes before recovery to differentiate between moderate and severe pain was 57 (Fig. 2).
4. DISCUSSION
In the current study, we found a statistically significant correlation between SPI 10 min before recovery and the highest NRS (r=0.555, p-value <0.001). With the highest sensitivity and specificity, the cut-off value of SPI 10 minutes before recovery to differentiate between moderate and severe pain was 57. On the other hand, no significant correlation was observed between SPI 5 min after skin incision and the highest NRS. Also, SPI 10 minutes was significantly correlated with postoperative tramadol consumption; however, SPI 5 minutes was not. Using simple linear regression, we found that, for each unit increase in the SPI 10 min, there was an expected increase in the highest NRS score by an average of 0.06 (95% CI: 0.04, 0.08) and an anticipated increase in the tramadol dose by an average 3.29 mg (95% CI: 2.05, 4.45). Further, the expected highest NRS score can be predicted from the equation: highest NRS= 3.96 + (0.06* SPI 10 min). The expected tramadol dose can be predicted from the equation: tramadol dose= 12.47 + (3.29* SPI 10 min).
Several studies have investigated the SPI scores as a monitor for patient autonomic response to surgical stimulation, the relationship between SPI and postoperative pain intensity, SPI as an intraoperative guide for antinociception management, and the cut-off value of SPI, which could differentiate between moderate and severe pain, also measurement timing. However, conflicting results exist [10, 13].
In their study, Jung et al. [10] found a significant correlation between SPI after skin incision and postoperative pain, with SPI ˃50, which was correlated with worse pain intensity and opioid consumption; they also described ΔSPI of 23 as the best cut-off predictor value. On the other hand, our study did not support their findings. This can be attributed to the fact that they did not include opioids with the induction agents; second, their primary outcome was to compare the highest postoperative NRS to ΔSPI (post-incision – pre-incision SPI); finally, their study included a relatively small number of participants (only 46 patients).
Consistent with our results, Ledowski et al. [12] found a significant correlation between SPI before arousal and postoperative pain scores. However, they described an SPI value of ˃ 30 as a cut-off value to predict moderate-to-severe pain with relatively low sensitivity and specificity; this contrasts with our finding that SPI 57 has a higher sensitivity and specificity. On the other hand, in an earlier study, Ledowski et al. [14] found no significant correlation between SPI and postoperative pain scores; they attributed this finding to the relatively small number of patients enrolled (only 65).
In another clinical trial, Ledowski et al. [8] described an SPI cut-off value of 40 in children as a predictor of moderate-to-severe pain. However, it is noteworthy that children might have lower SPI values at the same level of nociception compared to adults due to different cardiovascular structures and functions [15], This can explain why Ledowski et al. [8] found a lower SPI cut-off value than this study.
Another potential benefit of SPI is its use as an intraoperative guide for nociception-antinociception balance, and several clinical trials have investigated this potential benefit. However, conflicting results still exist [15]. One of the essential items regarding this conflict is the optimum SPI range that produces optimum nociception- antinociception balance, with a general role of SPI of 20-50 [15]. However, this is beyond the scope of the current study.
Our study found an association between SPI 10 minutes before recovery and postoperative nausea, which was not the case with SPI 5 minutes after the skin incision. This can be attributed to the correlation between SPI 10 and opioid consumption. Opioids are associated with many adverse effects, including nausea, vomiting, constipation, sedation, and respiratory depression. [10] However, we did not find any other adverse effects.
5. LIMITATIONS
Our study has some limitations. First, we compared just two measurements of SPI. Also, using analgesia with induction could affect the SPI 5 measurement. Second, we did not study the effect of patient demographics on SPI measurements, for example, age, which was noted to affect SPI scores. Third, the lack of similar studies limited comparisons of our data. However, to our knowledge, this is the first study to compare both measurements. Finally, our study is a single-center study, which could limit the generalizability of our data. Despite these limitations, our study can confirm the association between SPI measurements and pain scores. It also declared that pre-arousal SPI correlates more with postoperative pain scores and opioid consumption.
CONCLUSION
SPI is a good indicator for nociception. Pre-arousal SPI score correlates more with postoperative pain scores and opioid consumption than SPI score after skin incision. Also, SPI 10 minutes before recovery value of 57 was found to be the cut-off value, with the highest sensitivity and specificity, which could differentiate between moderate and severe pain.
AUTHORS’ CONTRIBUTIONS
MAH, MAA, and MAM contributed to data collection. MAH, MAA, and ASG performed data analysis. Writing was done by MAH,MAA, MAM, and RAA. Revising was done by MAH, RAA, ASG, MAA, and MAM. MAH, MAA, MAM, and ASG gave the study design. Patient recruitment was done by MAH. All authors contributed equally to this work. All authors discussed the results and commented on the manuscript.
LIST OF ABBREVIATIONS
| AF | = Atrial fibrillation |
| ASA | = the American Society of Anesthesiologists |
| BIS | = Bispectral Index |
| BMI | = body mass index |
| CI | = Confidence Interval |
| HR | = Heart Rate |
| IQR | = Interquartile Range |
| MAP | = Mean Arterial Blood Pressure |
| NRS | = Numeric Rating Scale |
| PACU | = Post Anesthesia Care Unit |
| PCA | = Patient-Controlled Analgesia |
| SD | = Standard deviation |
| SPI | = The Surgical Pleth Index |
ETHICS APPROVAL AND CONSENT TO PARTICIPATE
The ethical review board of Fayoum University Hospital approved the study design before the start of the study (M 703).
HUMAN AND ANIMAL RIGHTS
All procedures performed in studies involving human participants were in accordance with the ethical standards of institutional and/or research committee and with the 1975 Declaration of Helsinki, as revised in 2013.