All published articles of this journal are available on ScienceDirect.

Environmental and Economic Impacts of End-tidal Control of Volatile Anesthetics: A Scoping Review and Analysis
Authors Info & Affiliations
Abstract
Objective
This review aimed to assess the environmental and economic impacts of End-tidal Control (ET control) compared to manual clinician administration of inhaled anesthetics.
Methods
A scoping literature review was conducted to evaluate the consumption of anesthetic agents when using the Et Control software medical device compared to standard care (manual clinician adjustments) and the associated environmental/economic outcomes. Data were pooled across studies, and standardized mean difference, non-standardized weighted mean difference, and relative reduction in anesthetic agent usage between Et Control and manual adjustments were calculated. Annual reductions in hospital costs and greenhouse gas emissions for a representative 592-bed academic medical center were calculated.
Results
Eight out of the ten identified studies demonstrated that Et Control reduced anesthetic agent usage rates compared to manual administration. Based on the compiled evidence, Et Control results in a mean decrease of anesthetic agent usage by 32.2% for desflurane, 30.1% for isoflurane, and 4.1% for sevoflurane. The annual cost-savings and environmental impact for a large academic medical center using Et Control instead of manual administration is conservatively estimated to be $95,536 ($16,136 per 100 beds), with greenhouse gas emissions reduced by 434,345 kg (73,360 per 100 beds) in CO2 equivalencies (~100 motor vehicle emissions annually).
Conclusion
Our focused review and analysis indicate that Et Control reduces greenhouse gas emissions of anesthesia practice while also conferring cost-savings. The ability of semi-closed loop anesthesia systems to facilitate low-flow anesthesia warrants the need for future research to understand the full scope of environmental and economic impacts.
1. INTRODUCTION
Inhalational anesthetics are traditionally delivered by clinicians with frequent manual adjustments to anesthetic concentrations and fresh gas flows. Recent advancements in anesthesia system technologies allow for semi-closed loop adjustments in anesthetic and oxygen gas composition and flow rates to meet clinical targets set by the provider [1-4]. Various anesthesia systems are available worldwide, while only End-tidal Control (Et Control, GE HealthCare, Chicago, IL) is currently approved for use in the United States with the Aisys™ CS2 anesthesia delivery system (GE HealthCare, Chicago, IL).
Semi-closed loop anesthesia delivery systems have been shown to successfully achieve the desired anesthesia end-tidal targets and significantly decrease the incidence of undershooting or overshooting anesthetic or oxygen levels [5]. These systems have also been shown to significantly reduce the number of adjustments to gas flows and anesthetics required during patient care and facilitate the delivery of low-flow inhaled anesthesia [2-4]. By facilitating low-flow anesthesia, semi-closed loop systems reduce anesthetic gas consumption during surgical procedures, which has important environmental and economic advantages [1-4].
As indicated by the most recent report by the United Nations’ Intergovernmental Panel on climate change, reduced environmental emissions across all economical sectors and industries, including healthcare, are needed to avoid irreversible change to the world’s climate [6]. Greenhouse gas emissions are the largest contributor to the rise in global temperatures [7]. In the United States, the need to accelerate reductions in healthcare-associated greenhouse gas emissions, which make up ~8.5% of U.S. greenhouse gas emissions, has recently been addressed by both the Center for Medicare and Medicaid Services and the Department of Health and Human Services [8-10].
The fluorinated anesthetic agents sevoflurane, isoflurane, and desflurane are widely used in anesthesiology due to their stability, favorable toxicity profiles, and efficacy [11]. Unfortunately, these agents undergo little metabolism in the body and are most commonly released into the atmosphere through the Waste Anesthetic Gas Disposal System (WAGS) utilized in the operating room [12]. In reference to the 100-year Global Warming Potential (GWP100), a metric used to quantify the radiative and atmospheric properties of a particular gas relative to CO2, sevoflurane, isoflurane, and desflurane has a respective GWP100/kg of 127, 565, and 2720 [13, 14]. In other words, these gases are ~120-2700x more potent in their warming effects in the atmosphere than CO2. These potent anesthetic agents contribute up to 5% of hospital’s total greenhouse gas emissions and have become a focus of strategies to develop more environmentally sustainable practices in anesthesia [15]. The potential to reduce anesthetic gas usage through semi-closed loop anesthesia delivery systems presents an important opportunity to contribute to climate goals.
Et Control was introduced into clinical practice outside the United States in 2010 and is used in over 100 countries [1-4, 16]. In March 2022, the FDA approved Et Control as a Class III software medical device, and the first semi-closed loop inhaled anesthesia delivery technology for use in the United States [17, 18]. We are conducting this analysis as a thorough review of the clinical experience with Et Control to inform the clinical community who are not familiar with semi-closed loop delivery of oxygen and inhaled anesthetics. We have focused this analysis on Et Control to provide evidence that coincides with the U.S. market's introduction of new clinical users. This scoping review provides a thorough examination of the environmental (as assessed by greenhouse gas emissions) and economic impacts (as assessed by recurrent cost-savings) of Et Control through reductions in anesthetic consumption when compared to manual anesthetic delivery.
2. METHODS
2.1. Study Design and Literature Review
A focused, scoping literature review was conducted to assess the environmental (i.e., greenhouse gas emissions) and economic outcomes (i.e., recurrent cost-savings) of Et Control when compared to standard care (manual clinician adjustments of gas flows and anesthetic agents). Outcome measures of interest included anesthetic agent utilization rates, assessment of greenhouse gas emissions, and economic evaluations by studies comparing Et Control and standard care. As the present study extracted data from previously published sources, no primary data collection involving human participants was undertaken. Therefore, ethical approval for this study was not required. The analyses conducted in this paper strictly adhere to the ethical guidelines and regulations established by the original data sources that provided anesthetic agent utilization rates [1-4, 19-24].
An electronic database search was conducted for studies performed in adult populations that were published between January 1, 2013, and February 28, 2023. Databases that were searched include PubMed, Embase, Cochrane Central Register of Controlled Trials (CENTRAL), and Google Scholar. The search strategy applied to Pubmed and Embase included the terms “end-tidal, end-tidal control, anesthesia, automatic control, manual control, semi-closed loop, automated gas control, closed loop, and conventional.” Studies were also manually searched by retrieving studies cited by publications identified in the electronic database search, review papers, and communications with relevant experts/principal investigators. No geographic restrictions were applied; however, only studies with the full text written in English were eligible for inclusion. For anesthetic agent utilization rates, studies were included if they reported usage rates for isoflurane, desflurane, and sevoflurane; these anesthetic agents were selected due to their predominant use during inhalation anesthesia and relevance to the clinical community [11]. Studies were excluded from the analysis if the mean or Standard Deviation (SD) could not be derived based on the provided data. A full-text review of the identified studies was conducted by two separate reviewers to assess the robustness of sample size, use of Et Control, and the relevance of reported findings (e.g., gas utilization rates). If further clarification on study methodology or findings were required, correspondence was solicited from the respective authors or journal editors in accordance with Cochrane policy [25].
2.2. Data Extraction, Preparation, and Analysis
2.2.1. Anesthetic Agent Utilization Rates
Based on the evidence compiled from the literature review, we extracted data from relevant studies on flow rate, anesthetic agent utilization rates, and the number of cases of anesthesia delivered by Et Control or manual clinician adjustments. Data for anesthetic agent utilization rates were extracted as the mean volume (mL) per hour usage of the anesthetic agent; in cases where this value was not provided, mL/hour usage rates were calculated based on the absolute volume used normalized to the longest reported timepoint of anesthesia for the respective volume [3, 4, 20, 21].
Data across studies were pooled per each respective anesthetic agent, and the Standardized Mean Difference (SMD) and non-standardized weighted mean difference were calculated using the published mean and SD for anesthetic agent usage rates. For studies that only reported mean and 95% CI or p-values, the SD was derived according to the Cochrane Handbook of Systematic Reviews [26]. The mean and SD were derived according to Wan et al. for studies that only provided the median and the 25th and 75th percentiles [27]. For articles that provided the median and IQR (75th-25th percentile), the mean was assumed to be the median, and the SD was derived according to Wan et al. [27]. Between-study heterogeneity of the analysis was quantified using the I2 statistic [28].
We quantified the average proportional reduction in each anesthetic across studies. To derive the relative reduction in anesthetic agent usage with Et Control or manual adjustments, we first calculated the percent difference in means (i.e., (Et Control – Manual)/Manual *100). For each gas, the relevant study’s percent difference was weighted by the corresponding total sample size (i.e., the sum of the sample size of the Et Control and Manual arms) to derive a weighted mean relative change and its 95% confidence interval. These analyses were performed using Stata/MP 17.0 for Windows (StataCorp, LLC College Station, TX), and all p-values < 0.05 were considered statistically significant.
2.2.2. Annual Anesthetic Agent Usage
Annual volatile anesthetic agent consumption quantities were modeled based on a 592-bed “large academic medical center” from Zuegge et al., which included 31,779 anesthetics delivered in 43 operating rooms plus Non-Operating Room Anesthetizing (NORA) locations [29]. Annual anesthetic consumption is represented as bottles of desflurane (1,354), sevoflurane (3,663), and isoflurane (407) [29]. Values from Zuegge et al. were used to model anesthetic agent consumption representative of a large academic medical center that treats diverse patient cases and medical conditions, where such comprehensive data on hospital-wide anesthetic agent usage is limited [29].
2.2.3. Economic Impact of Et Control
The potential for economic benefits was assessed by applying the relative proportional reduction in anesthetic agent utilization to the consumption quantities of a representative large academic medical center. The annual savings were calculated using the reduction in the use of anesthetic agents and the cost per bottle of a respective anesthetic agent obtained from Zuegge et al. and inflated to 2023 USD using the U.S. consumer price index [29, 30].
2.2.4. Environmental Impact of Et Control
To assess the potential environmental impacts of Et Control, we estimated the reductions in CO2 Equivalency (CDE) that may occur due to decreased anesthetic agent usage with Et Control compared to manual clinician adjustments for a large academic medical center [29]. Using the estimated reductions in CDE, the GWP100 for each respective anesthetic agent was calculated, accounting for the hepatic metabolism of sevoflurane as 3%, isoflurane 0.2%, and desflurane 0.02% [1, 13, 14]. Reduction in annual CDE was estimated based on the calculated relative reduction in anesthetic agent usage between Et Control and manual adjustments. CDE of a particular gas was obtained by multiplying the mass emitted in kilograms/hour and the known GWP100 of the agent, such that (mL agent) × (agent density, in g/mL) × (1 kg/1000 g) × (GWP agent) = CDE of the agent [29].
3. RESULTS
3.1. Review of Anesthetic Agent Utilization Rates
Ten studies were identified that evaluated anesthetic agent utilization rates, assessed environmental impacts, and assessed economic outcomes when comparing Et Control and manual clinician adjustment for anesthesia delivery (Fig. 1). Study characteristics are summarized in Table 1. Of the identified studies, eight assessed outcomes for sevoflurane, five for desflurane, and two for isoflurane. Eight out of the ten studies indicated that anesthetic agent usage rates were decreased when Et Control was used for anesthetic delivery compared to manual adjustments [1-3, 19-22, 24], while two studies found a higher usage rate of sevoflurane with Et Control compared to manual adjustments when using equivalent fresh gas flow rates [4, 23].
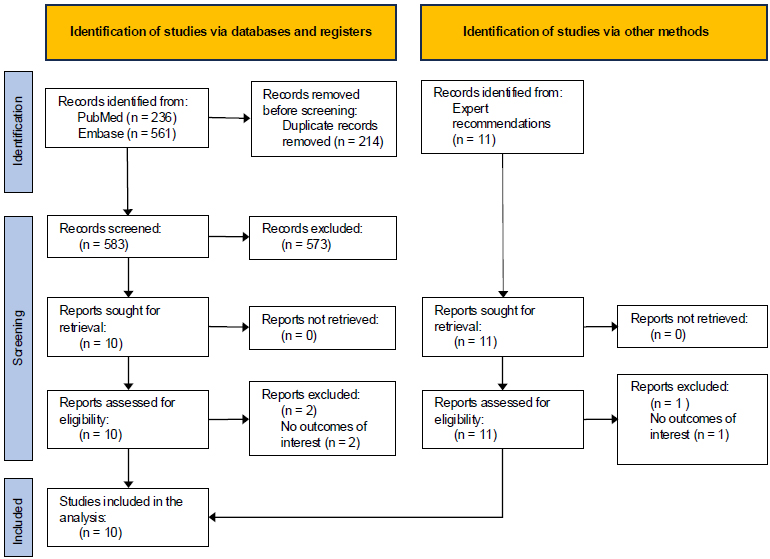
PRISMA flow diagram.
Note: Record counts identified from databases and expert recommendations were not mutually exclusive.
| Study/Refs. | Geography | Study Design | Study Population | No. of Patients | The Flow Rate of Anesthesia Machine | Measured Anesthetic Agent | Measure Timeframe |
|---|---|---|---|---|---|---|---|
| Arora et al, 2020 [3] | India | RCT | Patients undergoing surgery requiring general anesthesia | EtC = 42 MC = 42 |
EtC = 1 L/min MC = 1 L/min |
Desflurane | 2 hours after induction |
| Kandeel et al, 2017 [19] | Egypt | RCT | Patients undergoing living donor right hepatectomy | EtC = 20 MC = 20 |
EtC = 2 L/min MC = 2 L/min |
Sevoflurane | Mean anesthesia duration: MC = 390 minutes EtC = 399 minutes |
| Lucangelo et al, 2013 [20] | Italy | Prospective observational | Patients undergoing elective abdominal surgery | EtC = 40 MC = 40 |
EtC = 1 L/min MC = 1 L/min |
Sevoflurane | Surgeries >1 hour in duration |
| MASTER trial [24] | United States | RCT | Patients scheduled for non-emergent surgery | EtC = 100 MC = 108 |
EtC = NS MC = 0.5 L/min |
Desflurane, Sevoflurane, Isoflurane | From induction to disconnect |
| Mostad et al, 2021 [21] | Norway | RCT | Patients undergoing robot-assisted laparoscopic surgery | EtC = 37 MC = 34 |
EtC = NS MC = 1 L/min |
Desflurane | 60 minutes after initiation of desflurane |
| Potdar et al, 2014 [22] | India | RCT | Patients undergoing laparoscopic abdominal or pelvic surgeries | EtC = 100 MC = 100 |
EtC = 1.5 L/min MC = 1.5 L/min |
Sevoflurane | Surgeries 30 minutes - 4 hours in duration |
| Singaravelu et al, 2013 [2] | United Kingdom | Prospective, service evaluation and clinical audit | Patients undergoing gynaecological procedures | EtC = 117 MC = 20 |
EtC = NS MC = NS |
Sevoflurane, Desflurane | Surgeries >60 minutes in duration |
| Skalec et al, 2017 [4] | Poland | Prospective, observational | Patients undergoing abdominal and thyroid surgeries | EtC = 35 MC = 39 |
EtC = 1 L/min MC = 1 L/min |
Sevoflurane | Median duration of anesthesia: MC = 125 minutes EtC = 105 minutes |
| Tay et al, 2013 [1] | Australia | Prospective observational | Patients undergoing elective and emergency surgery | EtC = 1,810 MC = 1,865 |
EtC = 0.5 L/min MC = 0.5 L/min (Desflurane, Isoflurane) MC = 2 L/min (Sevoflurane) |
Desflurane, Sevoflurane, Isoflurane | Mean duration of anesthesia: MC = 69 minutes EtC = 64 minutes |
| Wetz et al, 2017 [23] | Germany | CCT | Patients undergoing elected surgeries | EtC = 30 MC = 34 |
EtC = 0.5 L/min MC = 0.5 L/min |
Sevoflurane | 1 hour from connection |
| Anesthetic Agent | Et Control | Manual Control | Study/Refs. | ||
|---|---|---|---|---|---|
| No. of patients |
Agent usage (Mean ± SD, mL/hr) |
No. of patients |
Agent usage (Mean ± SD, mL/hr) |
||
| Desflurane | |||||
| 42 | 14.36 ± 2.86a | 42 | 16.49 ± 2.86a | Arora et al., 2020 [3] | |
| 27 | 3.61 ± 1.44 | 19 | 4.89 ± 2.59 | MASTER Trial [24] | |
| 37 | 15.20 ± 1.80 | 34 | 25.80 ± 1.10 | Mostad et al., 2021 [21] | |
| 74 | 17.00 ± 6.47a | 4 | 33.00 ± 6.28a | Singaravelu et al., 2013 [2] | |
| Sevoflurane | |||||
| 20 | 12.60 ± 2.60 | 20 | 15.00 ± 2.90 | Kandeel et al., 2017 [19] | |
| 40 | 7.00 ± 1.80b | 40 | 7.40 ± 1.35b | Lucangelo et al., 2013 [20] | |
| 56 | 7.17 ± 2.12 | 82 | 7.54 ± 2.10 | MASTER Trial [24] | |
| 100 | 10.20 ± 3.14a | 100 | 12.00 ± 3.14a | Potdar et al., 2014 [22] | |
| 43 | 9.00 ± 1.63a | 16 | 14.00 ± 4.69a | Singaravelu et al., 2013 [2] | |
| 35 | 7.03 ± 2.24c | 39 | 4.94 ± 1.36c | Skalec et al., 2017 [4] | |
| 30 | 7.13 ± 0.83b | 34 | 6.10 ± 0.97 | Wetz et al., 2017 [23] | |
| Isoflurane | |||||
| 17 | 5.57 ± 2.16 | 15 | 7.97 ± 2.08 | MASTER Trial [24] | |
aFor studies that reported mean and 95% CI values, or mean and p-values, SD was derived using published methodology from Higgins et al. [26].
bFor studies that reported median values and the 25th and 75th percentiles, the mean value and SD were derived using published methodology from Wan et al. [27].
cFor studies that reported median values and interquartile ranges, the mean value was assumed to be equivalent to the reported median value, and SD was derived using published methodology from Wan et al. [27].
Nine studies were included for further analysis of the economic and environmental benefits due to Et Control-associated reductions in anesthetic agent utilization rates. The mean values and SD for anesthetic agent usage rates utilized for our analysis are provided in Table 2. Tay et al. was excluded from further analysis because the data reported was not sufficient to derive a reliable mean/SD value for anesthetic agent usage [1].
To measure an overall/average impact on anesthetic agent utilization when utilizing Et Control compared to manual clinician adjustments across studies, the SMD and non-standardized weighted mean difference were calculated for each respective gas. Significant differences were detected for the SMD of desflurane (SMD, -1.3; 95% CI, -1.62 to -0.97; p<0.001), sevoflurane (SMD, -0.19; 95% CI, -0.35 to -0.03; p=0.019), and isoflurane (SMD, -1.13; 95% CI, -1.88 to -0.38; p=0.003); desflurane and isoflurane had large effect sizes (absolute SMD value >0.8) (Table 3). In terms of relative reductions, Et Control resulted in significant decreases in usage rates of desflurane and sevoflurane that resulted in a 32.2% (95%CI, -33.9% to -30.5%; p<0.001) and 4.1% (95%CI, -5.6% to -2.5%; p<0.001) lower relative anesthetic agent utilization rate compared to manual clinician adjustments (Table 3). Et Control resulted in significant decreases in anesthetic agent utilization rates for desflurane and isoflurane with a non-standardized weighted mean difference of -7.32 mL/hour (95% CI, -7.86 to -6.78; p<0.001) and -2.4 mL/hour (95% CI, -2.87 to -0.93; p=0.001), respectively, compared to manual adjustments.
Since there were relatively few studies that met the inclusion criteria for this review, heterogeneity in the study protocols and patient populations was tested across studies. The I2 statistic was significant (p<0.001) for pooled studies assessing desflurane (I2=96.8%), sevoflurane (I2=93%), and isoflurane (I2=100%).
3.2. Economic Evaluation and Greenhouse Gas Emission Assessment
The economic evaluation and greenhouse gas emission assessment of decreased anesthetic agent usage with Et Control compared to manual adjustments are displayed in Tables 4 and 5. Based on the mean relative reduction of anesthetic agent usage across all studies identified by the scoping literature review, our findings reveal that cost reductions occurred on a yearly basis with the use of Et Control compared to manual adjustments (Table 4). The annual cost-savings for a large academic medical center using Et Control instead of manual adjustments was estimated to be $95,536 ($16,136 per 100 beds), with decreased usage of desflurane accounting for the largest portion of cost-savings ($80,249 for the center; $13,554 per 100 beds) followed by a reduction in costs for sevoflurane ($14,154 for the center; $2,390 per 100 beds). The reduced usage of anesthetic agents with Et Control compared to manual adjustments also resulted in a substantial decrease in greenhouse gas emissions. Et Control decreased the greenhouse gasses emitted by anesthetic agents equivalent to a reduction of 434,345 CDE (73,360 per 100 beds) annually per hospital, with decreased usage of desflurane being the largest contributor with an annual reduction of 417,004 CDE (70,431 per 100 beds) followed by a decrease of 10,379 CDE (1,753 per 100 beds) for isoflurane (Table 5).
4. DISCUSSION
The findings from our review and analysis reveal that Et Control is associated with economic and environmental benefits compared to manual clinician administration of inhaled anesthesia. These findings come from studies conducted in multiple countries where Et Control has been successfully implemented, and this is the first comprehensive review to assess the impact of Et Control as a pooled analysis of published results. The benefits of Et Control are derived from the ability of Et Control to reduce the consumption of volatile anesthetic agents
| Anesthetic Agent | No. of Patients |
Agent Usage (SMD, 95% CI) |
p value |
Agent usage (WMD, 95% CI, mL/hr) |
p value |
Agent Usage (RPR, 95% CI) |
p value |
|---|---|---|---|---|---|---|---|
| Desflurane | EtC = 180 MC = 90 |
-1.30 (-1.62, -0.97) | <0.001 | -7.32 (-7.86, -6.78) | <0.001 | -32.2% (-33.9% to -30.5%) | <0.001 |
| Sevoflurane | EtC = 324 MC = 331 |
-0.19 (-0.35, -0.03) | 0.019 | 0.20 (-0.08, 0.49) | 0.164 | -4.1% (-5.6% to -2.5%) | <0.001 |
| Isoflurane | EtC = 17 MC = 15 |
-1.13 (-1.88, -0.38) | 0.003 | -2.40 (-2.87, -0.93) | 0.001 | -30.1% | NA |
| Anesthetic Agent | Annual Consumptiona: MC (bottle) | Annual Consumptionb: EtC (bottle) | Average Purchasing Price per Bottlea (USD) | Annual Cost Savings (USD) |
|---|---|---|---|---|
| Desflurane | 1,354 | 918 | $184 | $80,248.89 |
| Sevoflurane | 3,663 | 3,514 | $95 | $14,154.22 |
| Isoflurane | 407 | 284 | $8 | $933.08 |
| Total | 5,424 | 4,717 | $95,336.18 |
aAnnual volatile anesthetic agent consumption quantities and average purchasing prices were obtained from a 592-bed academic medical center as part of the University of Wisconsin Health in 2015, published in Zuegge et al. [29]. All cost values were inflated to 2023 USD using the US consumer price index, calculated by the US Inflation Calculator [30].
bAnnual volatile anesthetic agent consumption quantities in the EtC group were estimated based on the relative usage reduction rates reported in Table 3.
| Anesthetic Agent | Annual Consumptiona: MC (mL) | Annual Consumptionb: EtC (mL) | Gas Density, g/ml | GWP100 per kg [13, 14] GWP100 | Annual CDE reductionc, kg |
|---|---|---|---|---|---|
| Desflurane | 324,960 | 220,290 | 1.465 | 2720 | 417,004.07 |
| Sevoflurane | 915,750 | 878,571 | 1.52 | 127 | 6,961.81 |
| Isoflurane | 40,700 | 28,445 | 1.502 | 565 | 10,378.97 |
| Total | 1,281,410 | 1,127,306 | 434,344.84 |
aAnnual volatile anesthetic agent consumption quantities were calculated based on the number of bottles purchased per year and the volume (mL) per bottle for each volatile agent, obtained from a 592-bed academic medical center as part of the University of Wisconsin Health in 2015, published in Zuegge et al. [29].
bAnnual volatile anesthetic agent consumption quantities in the EtC group were estimated based on the relative usage reduction rates reported in Table 3.
cCarbon dioxide equivalency (CO2 equivalency [CDE]) of a particular gas was obtained by multiplying the mass emitted in kilograms and the known GWP100 of the agent factoring in the hepatic metabolism sevoflurane as 3%, isoflurane 0.2% and desflurane 0.02% [1]. Specifically, CDE of the agent = (ml/hr agent) × (agent density, in g/mL) × (1 kg/1000 g) × (GWP100 agent) × (1 - % hepatic metabolism).
through breath-by-breath monitoring of end-tidal gases and fresh gas flow and vaporizer adjustments. These frequent adjustments reduce manual, repetitive tasks required of the provider, and, on average, the clinician plus Et Control delivers a more stable, accurate, and precise anesthetic at lower flows than the clinician alone. Our analysis of the published literature indicated that Et Control may reduce anesthetic agent usage by up to ~32% (e.g., desflurane) compared to manual administration, resulting in cost-savings for anesthetic agents and a reduction in greenhouse gas emissions. Our findings provide a comprehensive review of the Et Control literature to inform decision-makers in the assessment of potential environmental and economic benefits conferred by Et Control for their facility or system.
Previous studies have independently estimated the economic benefits of Et Control when compared to manual clinician adjustments. Singaravelu et al. reported a reduction in the consumption of sevoflurane and desflurane when using Et Control, which yielded a 40-55% decrease in anesthetic agent costs [2]. Although excluded from our analysis, Tay et al. found that the use of Et Control reduced anesthetic agent usage, resulting in a 27% decrease in anesthetic agent costs for a hospital with ~7,500 general anesthesia procedures per year [1]. Potdar et al. and Arora et al. also reported decreased anesthetic agent usage, which resulted in decreased costs of 15% and 14%, respectively [3, 22]. These estimates of cost-savings are consistent with the pooled findings in this study and demonstrate that although underlying study methodologies may vary, a consistent trend exists for the reduction in anesthetic agent usage when Et Control is used in place of manual administration.
Since the majority of studies included in our analysis utilized equivalent fresh gas flow rates between Et Control and manual administration (e.g., 1.5L/min vs. 1.5L/min), it is possible that greater waste reduction and cost-savings could be realized if Et Control is used to deliver anesthesia at flow rates lower than what is commonly used in clinical practice. In fact, the evidence from Singaravelu et al. indicates that the use of Et Control can result in a mean decrease of fresh gas flow rates by over 50% compared to flow rates used during manual clinician administration [2]. This observation is supported by findings from Kandeel et al., which report a 72% reduction in sevoflurane consumption when using a fresh gas flow rate of 0.5L/min with Et Control compared to a flow rate of 2L/min with manual adjustments [19]. Lower fresh gas flow rates are essential for economic and environmental (i.e., greenhouse gas emissions) benefits to be realized, as fresh gas flow rates are tied directly to the consumption of anesthetic agents [31].
Our findings revealed that utilization of Et Control could result in an estimated cost savings of $95,536 ($16,136 per 100 beds) for a large academic medical center through reductions in anesthetic agent consumption. Edmonds et al. have previously estimated cost-savings for implementing lower flow rates across a tertiary medical center in the United States [31]. They estimated that a flow rate of 0.5L/min could result in over $91,000 higher cost-savings (in 2023 USD) compared to a flow rate of 2.5L/min. Applying the relative reduction rates in anesthetic agent consumption when anesthesia is delivered with lower fresh gas flow rates according to Edmonds et al. [31], utilizing Et Control to decrease the mean fresh gas flow rate from 2.0L/min to 1.0L/min or 0.5L/min in the current findings would result in an estimated cost-savings of $181,587 ($30,670 per 100 beds) and $264,932 ($44,747 per 100 beds) for sevoflurane usage, respectively. Collectively, these values exemplify the potential of Et Control to confer greater cost-savings when used to deliver anesthesia at fresh gas flow rates lower than what is commonly used during manual clinician adjustments. The anesthetic usage proportions and fresh gas flow rates of clinical practices may vary significantly, thus requiring individualized analysis to determine the potential impact of Et Control.
This analysis estimated that the average decrease in anesthetic agent usage results in a reduction of yearly greenhouse gas emissions by over 430,000 CDE (~73,000 per 100 beds) [32]. This represents a ~29% decrease in greenhouse gas emissions from anesthetic agents and is equivalent to removing the emissions of ~100 U.S. motor vehicles annually (48,874 gallons or 185,008 liters of gasoline consumed) according to the average vehicle emission values provided by the United States Environmental Protection Agency (EPA) [32]. Although most studies identified by our scoping literature review alluded to the potential for environmental benefits [3, 21-23], only one study assessed the environmental impact of Et Control [1]. Tay et al. found that the use of Et Control resulted in a 44% decrease in greenhouse gas emissions compared to manual adjustments [1]. Notably, the reductions in greenhouse gas emissions reported by Tay et al [1]. are higher than the estimates provided by our current analysis. In this regard, it is plausible that even greater decreases in emissions would be observed if Et Control is used to decrease fresh gas flow rates lower than what is currently used in clinical practice [2, 31]. The choice of fresh gas flows for a practice or an individual may be due to several reasons, including concerns about safety at low gas flows and the possibility of inadequate anesthesia and hypoxemia. Et Control has been demonstrated to reliably achieve both end-tidal anesthetic and oxygen targets, thus potentially offsetting safety concerns with low flows and providing the confidence to practice low-flow anesthesia and further reduce greenhouse gas emissions. Worth noting, the use of fresh gas flow rates less than 1L/min with sevoflurane has been avoided by some clinicians due to concern of nephrotoxicity in rodents hypothesized as a result of compound A production [33]. However, the evidence supporting compound A production during low-flow anesthesia in humans has been disputed, and robust evidence indicates that sevoflurane can be safely used during low-flow anesthesia [34, 35].
Overall, our assessment of the literature revealed a limited number of relevant studies. The studies included in our analysis employed heterogeneous methodologies (e.g., patient populations and target fresh gas flow rates), which was supported by a significant I2 statistic. To account for this, our approach utilized the relative proportional reduction rate for estimations of economic and environmental impacts in order to provide additional internal control for comparing findings across studies. Nonetheless, caution may be warranted for interpreting the findings given the heterogeneous protocols utilized, which may result in over or underestimation of the underlying findings. For instance, our findings revealed modest reductions in sevoflurane usage with Et Control. The majority of studies found a decrease in sevoflurane consumption while using Et Control compared to manual adjustments [2, 19, 20, 22, 24]. Among these, Kandeel et al. had prior published comments addressing potential data concerns and considerations, such as the primary driver for differences between delivery methods being the ability of Et Control to maintain fresh gas flow rates lower than manual control when used at flow rates of 0.5L/min [19, 36, 37]. Following the solicitation of responses from the authors and the journal editor, the authors were not able to gain additional clarifications on these points. Of note, this study accounted for only ~6% of the total patients in the current analysis who were administered sevoflurane between ET Control and manual control. The exclusion of Kandeel et al. would not impact the directionality of our findings and would decrease the estimated relative proportional reduction of sevoflurane usage with Et Control by 0.78% [19].
Two separate studies also observed an increase in sevoflurane usage [4, 23]. While it is difficult to fully understand the rationale for increased sevoflurane usage in these studies, given the provided study methods, is it plausible that marginally higher flow rates with Et Control may have contributed to these discrepancies. For example, the study by Wetz et al. required clinician researchers to not alter fresh gas flow rates from a 0.5L/min target and for clinicians to only make adjustments to gas composition; although Et Control was also utilized at a fresh gas flow rate of 0.5L/min, Et Control can adjust flow rates as needed to achieve target end-tidal gas concentrations. In this manner, it is plausible that these deviations may have resulted in an increased sevoflurane usage compared to clinicians who were required to be hyper-vigilant of maintaining targets using only alterations in gas composition. It is also possible that higher fresh gas flow rates during induction of anesthesia with Et Control were present based on factory defaults, whereas the manual group selected lower rates. Additional studies using real-world evidence collected in the United States will add to the clinical knowledge base on Et Control and contribute to ongoing clinical applications.
4.1. Limitations
Our analysis has several limitations. First, while the anesthesia machines used were all Aisys CS2 Anesthesia Systems (GE Healthcare) with Et Control, protocol heterogeneity may have contributed to variable anesthetic agent usage. Second, desflurane represented a large portion of our modeled hospital-wide anesthetic agent usage, which may have led to an overestimation of the impact of greenhouse gas emissions. Sevoflurane is increasingly becoming the preferred anesthetic agent used by anesthesia professionals, especially given the large greenhouse gas effect of desflurane [35]. Hence, our overall estimations of greenhouse gas emissions may be overestimated for hospital systems utilizing a larger proportion of sevoflurane; in this case, the relative reduction values per respective anesthetic agent can be utilized to appropriately estimate the environmental benefits for a given hospital system. Importantly, our findings of significantly lower sevoflurane usage with Et Control indicate the potential for environmental benefits to occur when compared to manual adjustments. Third, the inclusion of studies that utilized equivalent fresh gas flow rates between Et Control and manual administration may diminish the benefits of Et Control by not fully utilizing the low-flow capabilities of the system. Fourth, the diversity of countries where studies were conducted limits the opportunity to pool data from a specific geography. However, the diversity of sites may also suggest broad generalizability of this study’s findings, including in the United States, where Et Control has only recently received FDA approval. Lastly, for those interested in a comprehensive return-on-investment analysis, this study does not include costs associated with acquiring Et Control. The costs of implementing Et Control were not assessed due to variations in the pricing models for such technologies that occur across different regions, institutions, and timeframes. Further, the costs associated with these systems may benefit from economies of scale, especially in larger healthcare facilities with multiple operating theatres. The costs associated with implementing automated anesthesia systems can also evolve over time, potentially making specific cost figures less relevant or subject to frequent change. Accounting for these factors exceeded the scope of this review and prohibited an in-depth cost analysis.
CONCLUSION
Our findings demonstrate that Et Control can confer recurrent cost-savings and reductions in greenhouse gas emissions by significantly reducing the use of volatile anesthetic agents during inhaled anesthetic administration when compared to the manual process. Our analysis of the included studies indicates that the reduced anesthetic agent usage may conservatively result in the potential for cost-savings of over $95,000 (2023 USD) for a large academic medical center (when using similar proportions of anesthetic agents as the modeled center) while providing environmental benefits that are equivalent to eliminating the annual emissions of ~100 U.S. motor vehicles. Additional reductions in costs and greenhouse gas emissions are expected when the low-flow capabilities of Et Control are maximally utilized to reduce fresh gas flows.
AUTHORS’ CONTRIBUTIONS
J.B., W.J., H.H., and H.Y.: Participated in the design of this study; J.B. and W.J.: Screened titles and abstracts from the database search; H.Y. and H.H.: Independent evaluation of identified studies for their eligibility; J.B., R.K., J.P., M.E., W.J., H.H., and H.Y.: Performed the analysis. All authors reviewed and edited the writing for this manuscript. All authors approved of the final version of this manuscript.
LIST OF ABBREVIATIONS
| Et Control | = End-tidal Control |
| WAGS | = Waste anesthetic gas disposal system |
| GWP100 | = 100-year global warming potential |
| SMD | = Standardized mean difference |
| SD | = Standard deviation |
| IQR | = Interquartile range |
| CDE | = CO2 equivalency |
| SD | = Standard Deviation |
| SMD | = Standardized Mean Difference |
| NORA | = Non-Operating Room Anesthetizing |
| CDE | = CO2 Equivalency |
AVAILABILITY OF DATA AND MATERIALS
The data and supportive information are available within the article.
CONFLICT OF INTEREST
"JB is an employee of GE HealthCare. RK reports consulting for GE HealthCare. JP reports consulting for GE HealthCare. ME is a member of Mary Erslon, LLC and reports consulting for GE HealthCare. WJ, HH, and HY are employees of Boston Strategic Partners, which received funding support from GE HealthCare".
ACKNOWLEDGEMENTS
Declared none.