All published articles of this journal are available on ScienceDirect.

Use of Either Non-invasive Ventilation Immediately Post-extubation or Controlled Mechanical Ventilation for One Hour after Fulfilling Weaning Criteria Decreases Re-intubation of Patients with Post-traumatic ARDS
Abstract
Introduction:
Re-intubation and re-ventilation after complete weaning of patients with prolonged ventilation are considered a major problem in ICU. The re-intubation in such patients associated with higher mortalities prolongs the duration of ICU stay. The mortality rate in those patients may exceed 40% in some studies.
Aims:
The study aimed to compare and evaluate the effect of use of two new maneuvers with control after fulfilling criteria of weaning from prolonged ventilation, either immediate use of NIV post-extubation and every 12 hours for 24 hours or MV for one hour on both re-intubation and ICU discharge of traumatic ARDS patients who ventilated for one week or more.
Materials and Methods:
It is a prospective double-blind study done on total 300 patients, admitted with respiratory failure ARDS due to severe lung contusion. All of them were selected to be ventilated for > one week. All of them fulfilled the criteria of weaning at the end of the studied period. Patients were randomly allocated in three groups; each group contained 100 patients. Group A was considered the control group. They extubated and followed our routine protocol; patients of group B used our first new maneuver and reconnected to mechanical ventilation before extubation for one hour, while patients of group C used our second new maneuver; patients of this group extubated and immediately connected to NIV with BIPAP mode for 1 hour every 12 hours for 24 hours.
Results:
There was a significant reduction in the number of patients who experienced deterioration in conscious level throughout the study in patients of both groups B and C compared to group A. Also, a significant reduction was seen in the number of patients who experienced deterioration in clinical parameters of respiration, of both groups B and C compared to group A with regard to high respiratory rate, desaturation and development of hyperdynamic circulation (tachycardia and hypertension). Also, a significant reduction was seen in the number of patients who had multiple quadrant parenchymatous infiltration throughout the study in patients of both groups B and C compared to group A. significant reduction in the number of patients marked limitation to FEV1, FVC and MVV in patients of both groups B and C compared to group A.
Conclusion:
Use of either immediate NIV every 12 hours for 24 hours or MV for one hour after fulfillment of weaning criteria reduced reintubation, re-ventilation and post-extubation respiratory failure and decreased the ICU stay in prolonged ventilated patients due to ARDS from severe lung trauma with no significant difference between them.
1. INTRODUCTION
Re-intubation and re-ventilation after complete weaning from prolonged ventilation are considered a major problem in critically ill patients. 5-30% of mechanically ventilated patients who completely weaned from the ventilator and extubated require re-intubation and re-ventilation [1]. Especially those who ventilated for more than one week, this prolongs the duration of ICU stay and starts a vicious circle again with high morbidity and mortality. This vicious circle starts by the development of attacks of VAP (ventilator-associated pneumonia) together with the wasting of diaphragm and respiratory muscle due to prolonged ventilation [2]. All these factors lead to difficulty in weaning from the ventilator and thus increase both morbidity, mortality and prolong the duration of the ICU stay with a concomitant increase in the cost of treatment. The mortality rate in these patients may exceed 40% in some studies [3]. Many ventilatory maneuvers have been introduced recently to decrease the percent of re-intubation and re-ventilation after full weaning and extubation, break this vicious circle and save the patients who ventilated for a long time (> 1week) from being ventilator dependent. Those maneuvers include the use of either invasive or noninvasive ways of assisted ventilation for certain periods until the patient can maintain oxygenation by his/her own respiratory muscles. The physiological notions for these maneuvers are to give time for patient's diaphragm and respiratory muscle to rebuild ATP and powerfully contract again after a prolonged period of rest from controlled ventilation [3-5]. In our center, we used the traditional way of extubation for a long time (explained in the material and methods), but recently there have been many new ways introduced in clinical practice [4]. Our center conducts this study to introduce two new maneuvers in the clinical practice of extubation and compare their results with the result of the traditional way of extubation used many years ago . The first one was immediate noninvasive ventilation (BIPAP) every 12 hours for only one day. The second was reconnection of the patients who were ventilated for one week or more to controlled mechanical ventilation for one hour before extubation. Besides the careful clinical assessment, with attention to underlying medical conditions and co- morbidities of those patients [5], the main causes of re-intubation in such patients should be kept in mind, which may be diaphragmatic and respiratory muscle fatigue from myopathy which developed from a prolonged time of ventilation, hidden underlying significant respiratory impairment prior to hospitalization and significant comorbidity which might be acquired in the hospital e.g.(critical illness neuropathy, and/ or upper air way problems from prolonged intubation) or previously known systemic disease e.g.(diabetes, hypertension, renal and/or liver impairment…etc.) which accelerate and aggravate the development of critical illness neuropathy and myopathy [6].
2. AIM OF THE WORK
The study aimed to compare and evaluate the effect of use of two new maneuvers with control after fulfilling criteria of weaning from prolonged ventilation, either immediate use of NIV post-extubation every 12 hours for 24 hours or MV for one hour on both re-intubation and ICU discharge of traumatic ARDS patients who ventilated for one week or more.
3. MATERIALS AND METHODS
It is a prospective, double-blind study on total 300 patients, admitted to King Abdelaziz specialist hospital in Taif, KSA. It started on April 2019 and ended on June 2020 with respiratory failure ARDS due to severe lung contusion with the following criteria: Hypoxic index less than 200, bilateral parenchymatous lung infiltrate, SPO2< 90% with Non-Invasive Ventilation (NIV) or the continuous need of NIV for more than 4 hours to maintain the previous saturation. Lung contusion was diagnosed by Computerized tomography of the chest. All patients selected to be ventilated for one week or more and only those who showed full criteria of weaning from the ventilator enrolled in our study. Our criteria of weaning include: fully conscious patients, hemodynamically stable without any inotropic support, hypoxic index (PAO2/FIO2) more than 200 calculated from the Arterial Blood Gases (ABG) and FIO2, bicarbonate level in arterial blood more than 20 mmol/l, hemoglobin level more than 10 gm/dL, chest X-ray less than one quadrant parenchymatous infiltration in each lung on Murray score of chest X-ray, rapid shallow breathing index <105. Patients were randomly allocated in one of three groups; each group contains 100 patients. The randomization sequence was created using Excel 2007 (Microsoft, Redmond, WA, USA) with a 1:1 allocation using random block sizes of 2 and 4 by an independent doctor. In this way, sequence generation and type of randomization can be expressed at the same time. Patients of group A (considered the control group of this study) were extubated and followed our routine protocol of management post-extubation, which includes Nebulization with Ventolin and epinephrine racemic every 8 hours for 48 hours. Chest Physical Therapy (CPT) every 6 hours for 48 hours includes clapping percussion with mechanical vibration and suction plus huffing or coughing and postural drainage if there was atelectasis seen by our routine chest X-ray. Patients of group B reconnected to mechanical ventilation before extubation for one hour with sedation with midazolam 3-5 milligram/hour intravenous infusion to achieve score 0 or -1on Richmond Agitation - Sedation Scale (RASS) (Table 1) [7]. 20 minutes before the end of this hour, midazolam infusion was discontinued and patients awoke and extubated. Those patients were subjected to Mechanical Ventilation (MV) with the following parameters, FIO2 40%, pressure SIMV mode, PEEP 8 cm H2O, pressure support 15cm H2O, respiratory rate 14/min, Peak Inspiratory Pressure (PIP) of 35cm H2O. Then patients were extubated and followed our previous protocol without the use of NIV.
| Richmond Agitation – Sedation Scale (RASS) | ||
|---|---|---|
| Score | Term | Description |
| +4 | Combative | Violent, immediate danger to staff |
| +3 | very agitated | Pulls catheters, tubes(aggressive) |
| +2 | Agitated | Aimless movement, fights ventilator |
| +1 | Restless | Anxious but movements not aggressive |
| 0 | alert and calm | - |
| -1 | Drowsy | Not fully alert but has eye Contact and opening>10 second |
| -2 | light sedation | Briefly awakens with eye contact <10 Second |
| -3 | Moderate sedation | Movement or eye opening to voice with no eye contact |
| -4 | Deep sedation | No response to voice; response to physical stimulation either by movement or eye opening |
| -5 | Unarousable | No response to voice or physical stimulation |
While patients of Group C extubated and immediately connected to NIV with BIPAP mode for 1 hour and this procedure was repeated every 12 hours for 48 hours. BIPAP was used in our study with the following parameters, 40% FIO2, PEEP 8 cm H2O, pressure support of 15 cm H2O. All patients were followed for 48 hours and data are represented every eight hours that are categorized as follows:
a. Clinical Data
Clinical data includes conscious level using the Glasgow coma scale GCS, respiratory rate, saturation using plethysmography for SPO2, hemodynamics including mean arterial blood pressure and pulse.
b. Radiological Data
It includes chest X-ray using the clinical parameters of Murray score for evaluation of the size of the parenchymatous lung infiltrate [8].
c. Laboratory Data
It includes Arterial Blood Gases (ABG) for monitoring of arterial PH, arterial blood oxygen (PaO2) and arterial blood carbon dioxide (PaCO2).
d. Dynamic Lung Volumes Data
This is monitored by Cosmed Pony FX Spirometer to assess three main parameters, (1) the forced expiratory volume in the first second (FEV1), (2) the Forced Vital Capacity (FVC) and (3) the Maximum Voluntary Ventilation (MVV). All these parameters are measured with their degree of reduction calculated according to both patient's sex and weight. Both clinical and dynamic lung volume parameters were recorded every 8 hours for 48 hours after extubation. The number of patients reintubated was recorded every 24 hours.
King Abdelaziz’s research and ethical committee approved the project. Written consent from the patient or their 1st degree relative was obtained if the patient was intubated.
Clinical evaluation of parenchymatous lung infiltrates in chest X-ray by Murray score (Table 2).
Exclusion criteria were age less than 18 years, a known Chronic Obstructive Lung Disease (COPD) patient, tracheostomy, overwhelming respiratory secretions, post-cardiac arrest, history of systemic disease (diabetes Mellitus, systemic hypertension and renal impairment or failure), and any type of myopathic disorder.
3.1. Statistical Analysis
The data was collected and entered into the personal computer. Statistical analysis was carried out using Statistical Package for Social Sciences (SPSS/version 21) software. For categorized parameters, chai square test was used. The level of significance was 0.05. Statistical analysis was conducted between group A and group B&C as the data showed marked variation while the data of group B and C was nearly the same, so no statistical analysis was needed for comparison (Table 3).
3.2. Sample Size
The sample size must be according to the research context, including the researcher’s objectives and proposed analyses.
The following formula was used to calculate the required sample size in this study;
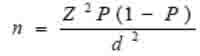 |
Where n is the sample size, Z is the statistic corresponding to the level of confidence, P is expected prevalence, and d is the precision (corresponding to effect size). The level of confidence was 95%. By using this equation, the sample size was 300 cases in each group (i.e. 100 cases in the three groups).
P value was considered significant if < 0.05.
| Score of severity | 0 | 1 | 2 | 3 | 4 |
|---|---|---|---|---|---|
| Chest X-ray | Non | 1 quadrant infiltrated | 2 quadrants infiltrated | 3 quadrants infiltrated | 4 quadrants infiltrated |
| Age in years | Group A (n=100) | Group B (n=100) | Group C (n=100) | P value |
|---|---|---|---|---|
| 18-30 | 24 | 26 | 25 | 0.999 |
| 31-45 | 43 | 44 | 42 | |
| 46-55 | 15 | 14 | 16 | |
| 56-65 | 12 | 11 | 12 | |
| >65 | 6 | 5 | 5 | |
| Sex | Group A (n=100) | Group B (n=100) | Group C (n=100) | P value |
| Male | 76 | 78 | 77 | 0.945 |
| Female | 24 | 22 | 23 |
4. RESULTS
4.1. Post-weaning Conscious Level
Conscious level is monitored post-extubation every eight hours for 48 hours and is illustrated in Table 4. There was a significant reduction in the number of patients who had deterioration in conscious level in the studied duration in patients of both groups B and C compared to group A.
| Conscious Level (GCS) |
1st 8 Hours “n=100” |
2nd 8 Hours “n=100” |
3rd 8 Hours “n=100” |
|||
|---|---|---|---|---|---|---|
| Group A | No. | % | No. | % | No. | % |
| 3-5 | 0 | 0 | 0 | 0 | 0 | 0 |
| 6-10 | 10 | 10 | 12 | 12 | 13 | 13 |
| 11-15 | 90 | 90 | 88 | 88 | 87 | 87 |
| Group B | - | - | - | - | - | - |
| 3-5 | 0 | 0 | 0 | - | 0 | 0 |
| 6-10 | 0 | 0 | 0 | - | 1 | 1 |
| 11-15 | 100 | 100 | 100 | 100 | 99 | 99 |
| Group C | - | - | - | - | - | - |
| 3-5 | 0 | 0 | 0 | 0 | 0 | 0 |
| 6-10 | 0 | 0 | 0 | 0 | 0 | 0 |
| 11-15 | 100 | 100 | 100 | 100 | 100 | 100 |
| P value | 0.006* | 0.001* | 0.0004* | |||
| Conscious Level (GCS) |
4th 8 Hours “n=100” |
5th 8 Hours “n=100” |
6th 8 Hours “n=100” |
|||
| Group A | No | % | No | % | No | % |
| 3-5 | 2 | 2 | 3 | 3 | 5 | 5 |
| 6-10 | 28 | 28 | 32 | 32 | 37 | 37 |
| 11-15 | 70 | 70 | 65 | 65 | 58 | 58 |
| Group B | - | - | - | - | - | - |
| 3-5 | 1 | 1 | 2 | 2 | 3 | 3 |
| 6-10 | 19 | 19 | 20 | 20 | 23 | 23 |
| 11-15 | 80 | 80 | 78 | 78 | 74 | 74 |
| Group C | - | - | - | - | - | - |
| 3-5 | 0 | 0 | 1 | 1 | 2 | 2 |
| 6-10 | 13 | 13 | 19 | 19 | 22 | 22 |
| 11-15 | 87 | 87 | 80 | 80 | 76 | 76 |
| P value | 0.0903 | 0.125 | 0.062 | |||
4.2. Post-weaning Clinical Parameters of Respiration and Hemodynamics
Respiratory rate is monitored post-extubation every eight hours for 48 hours and is illustrated in Tables (5-9).
Arterial oxygen saturation is monitored post-extubation every eight hours for 48 hours and illustrated in Table 8.
Partial pressure of oxygen in arterial blood is monitored post-extubation every eight hours for 48 hours and illustrated in Table 10.
Carbon dioxide is monitored post-extubation every eight hours for 48 hours and illustrated in Table 11.
PH is monitored post-extubation every eight hours for 48 hours and illustrated in Table 12.
Mean arterial blood pressure is monitored post-extubation every eight hours for 48 hours and illustrated in Table 6.
Pulse is monitored post-extubation every eight hours for 48 hours and illustrated in Table 7.
There was a significant reduction in the number of patients who had deterioration in clinical parameters of respiration with signs of hyperdynamic circulation due to disturbed blood gases throughout the study in patients of both groups B and C compared to group A with regard to high respiratory rate, desaturation and development of tachycardia and high mean arterial blood pressure.
| Respiratory Rate (breath/min) |
1st 8 Hours “n=100” |
2nd 8 Hours “n=100” |
3rd 8 Hours “n=100” |
|||
|---|---|---|---|---|---|---|
| Group A | No. | % | No. | % | No. | % |
| < 20 | 8 | 8 | 8 | 8 | 3 | 3 |
| 21-25 | 58 | 58 | 56 | 56 | 53 | 53 |
| 26-35 | 29 | 29 | 29 | 29 | 36 | 36 |
| >35 | 5 | 5 | 7 | 7 | 8 | 8 |
| Group B | - | - | - | - | - | - |
| < 20 | 29 | 29 | 27 | 27 | 23 | 23 |
| 21-25 | 40 | 40 | 40 | 40 | 39 | 39 |
| 26-35 | 31 | 31 | 33 | 33 | 36 | 36 |
| >35 | 0 | 0 | 0 | 0 | 2 | 2 |
| Group C | - | - | - | - | - | - |
| < 20 | 33 | 33 | 31 | 31 | 31 | 31 |
| 21-25 | 38 | 38 | 38 | 38 | 36 | 36 |
| 26-35 | 29 | 29 | 31 | 31 | 32 | 32 |
| >35 | 0 | 0 | 0 | 0 | 1 | 1 |
| P value | 0.0002* | 0.0001* | 0.00001* | |||
| Respiratory Rate(breath/min) |
4th 8 Hours “n=100” |
5th 8 Hours “n=100” |
6th 8 Hours “n=100” |
|||
| Group A | No. | % | No. | % | No. | % |
| < 20 | 3 | 3 | 3 | 3 | 2 | 2 |
| 21-25 | 52 | 52 | 51 | 51 | 50 | 50 |
| 26-35 | 33 | 33 | 31 | 31 | 26 | 26 |
| >35 | 12 | 12 | 15 | 15 | 22 | 22 |
| Group B | - | - | - | - | - | - |
| < 20 | 22 | 22 | 22 | 22 | 21 | 21 |
| 21-25 | 38 | 38 | 38 | 38 | 37 | 37 |
| 26-35 | 36 | 36 | 34 | 34 | 33 | 33 |
| >35 | 4 | 4 | 6 | 6 | 9 | 9 |
| Group C | - | - | - | - | - | - |
| < 20 | 31 | 31 | 30 | 30 | 29 | 29 |
| 21-25 | 38 | 38 | 37 | 37 | 37 | 37 |
| 26-35 | 29 | 29 | 30 | 30 | 27 | 27 |
| >35 | 2 | 2 | 3 | 3 | 7 | 7 |
| P value | 0.00025* | 0.0001* | 0.00061* | |||
| Mean Arterial Blood Pressure in (mmHg) |
1st 8 Hours “n=100” |
2nd 8 Hours “n=100” |
3rd 8 Hours “n=100” |
|||
|---|---|---|---|---|---|---|
| Group A | No. | % | No. | % | No. | % |
| < 100 | 27 | 27 | 20 | 20 | 18 | 18 |
| 101-110 | 49 | 49 | 49 | 49 | 42 | 42 |
| >110 | 24 | 24 | 31 | 31 | 40 | 40 |
| Group B | - | - | - | - | - | - |
| < 100 | 44 | 44 | 42 | 42 | 40 | 40 |
| 101-110 | 52 | 52 | 52 | 52 | 52 | 52 |
| >110 | 4 | 4 | 6 | 6 | 8 | 8 |
| Group C | - | - | - | - | - | - |
| < 100 | 55 | 55 | 52 | 52 | 50 | 50 |
| 101-110 | 43 | 43 | 44 | 44 | 45 | 45 |
| >110 | 2 | 2 | 4 | 4 | 5 | 5 |
| P value | 0.0002* | 0.0005* | 0.0001* | |||
| Mean Arterial Blood Pressure in (mmHg) |
4th 8 Hours “n=100” |
5th 8 Hours “n=100” |
6th 8 Hours “n=100” |
|||
| Group A | No. | % | No. | % | No. | % |
| < 100 | 18 | 18 | 18 | 18 | 13 | 13 |
| 101-110 | 42 | 42 | 42 | 42 | 33 | 33 |
| >110 | 40 | 40 | 40 | 40 | 54 | 54 |
| Group B | - | - | - | - | - | - |
| <100 | 40 | 40 | 40 | 40 | 39 | 39 |
| 101-110 | 51 | 51 | 50 | 50 | 50 | 50 |
| >110 | 9 | 9 | 10 | 10 | 11 | 11 |
| Group C | - | - | - | - | - | - |
| < 100 | 50 | 50 | 49 | 49 | 48 | 48 |
| 101-110 | 44 | 44 | 44 | 44 | 43 | 43 |
| >110 | 6 | 6 | 7 | 7 | 9 | 9 |
| P value | 0.00011* | 0.00036* | 0.00017* | |||
| Pulse (beat/min) |
1st 8 Hours “n=100” |
2nd 8 Hours “n=100” |
3rd 8 Hours “n=100” |
|||
|---|---|---|---|---|---|---|
| Group A | No. | % | No. | % | No. | % |
| > 80 | 28 | 28 | 26 | 26 | 18 | 18 |
| 81-100 | 50 | 50 | 51 | 51 | 51 | 51 |
| >100 | 22 | 22 | 23 | 23 | 31 | 31 |
| Group B | - | - | - | - | - | - |
| > 80 | 58 | 58 | 56 | 56 | 54 | 54 |
| 81-100 | 36 | 36 | 36 | 36 | 36 | 36 |
| >100 | 6 | 6 | 8 | 8 | 10 | 10 |
| Group C | - | - | - | - | - | - |
| > 80 | 61 | 61 | 60 | 60 | 57 | 57 |
| 81-100 | 35 | 35 | 35 | 35 | 36 | 36 |
| >100 | 4 | 4 | 5 | 5 | 7 | 7 |
| P value | 0.0001* | 0.0001* | 0.0003* | |||
| Pulse (beat/min) |
4th 8 Hours “n=100” |
5th 8 Hours “n=100” |
6th 8 Hours “n=100” |
|||
| Group A | No. | % | No. | % | No. | % |
| > 80 | 25 | 25 | 23 | 23 | 21 | 21 |
| 81-100 | 44 | 44 | 45 | 45 | 36 | 36 |
| >100 | 31 | 31 | 32 | 32 | 43 | 43 |
| Group B | - | - | - | - | - | - |
| > 80 | 54 | 54 | 52 | 52 | 51 | 51 |
| 81-100 | 34 | 34 | 34 | 34 | 33 | 33 |
| >100 | 12 | 12 | 14 | 14 | 16 | 16 |
| Group C | - | - | - | - | - | - |
| > 80 | 57 | 57 | 57 | 57 | 56 | 56 |
| 81-100 | 34 | 34 | 33 | 33 | 31 | 31 |
| >100 | 9 | 9 | 10 | 10 | 13 | 13 |
| P value | 0.00021* | 0.00035* | 0.00001* | |||
| Saturation (SPO2%) |
1st 8 Hours “n=100” |
2 nd 8 Hours “n=100” |
3rd 8 Hours “n=100” |
|||
|---|---|---|---|---|---|---|
| Group A | No. | % | No. | % | No. | % |
| > 95 | 61 | 61 | 57 | 57 | 55 | 55 |
| 94-85 | 38 | 38 | 41 | 41 | 43 | 43 |
| 84-80 | 1 | 1 | 2 | 2 | 2 | 2 |
| <80 | 0 | 0 | 0 | 0 | 0 | 0 |
| Group B | - | - | - | - | - | - |
| > 95 | 88 | 88 | 88 | 88 | 87 | 87 |
| 94-85 | 12 | 12 | 12 | 12 | 13 | 23 |
| 84-80 | 0 | 0 | 0 | 0 | 0 | 0 |
| <80 | 0 | 0 | 0 | 0 | 0 | 0 |
| Group C | - | - | - | - | - | - |
| > 95 | 93 | 93 | 93 | 93 | 93 | 93 |
| 94-85 | 7 | 7 | 7 | 7 | 7 | 7 |
| 84-80 | 0 | 0 | 0 | 0 | 0 | 0 |
| <80 | 0 | 0 | 0 | 0 | 0 | 0 |
| P value | 0.0001* | 0.0001* | 0.0001* | |||
| Saturation (SPO2%) |
4th 8 Hours “n=100” |
5th 8 Hours “n=100” |
6th 8 Hours “n=100” |
|||
| Group A | No. | % | No. | % | No. | % |
| > 95 | 54 | 54 | 54 | 54 | 53 | 53 |
| 94-85 | 31 | 31 | 24 | 24 | 19 | 19 |
| 84-80 | 12 | 12 | 14 | 14 | 16 | 16 |
| <80 | 3 | 3 | 8 | 8 | 12 | 12 |
| Group B | - | - | - | - | - | - |
| > 95 | 85 | 85 | 84 | 84 | 83 | 83 |
| 94-85 | 11 | 11 | 7 | 7 | 4 | 4 |
| 84-80 | 4 | 4 | 6 | 6 | 8 | 8 |
| <80 | 0 | 0 | 3 | 3 | 5 | 5 |
| Group C | - | - | - | - | - | - |
| > 95 | 92 | 92 | 90 | 90 | 88 | 88 |
| 94-85 | 6 | 6 | 4 | 4 | 2 | 2 |
| 84-80 | 2 | 2 | 4 | 4 | 6 | 6 |
| <80 | 0 | 0 | 2 | 2 | 4 | 4 |
| P value | 0.00041* | 0.0014* | 0.00026* | |||
| Chest X-ray Infiltration |
1st 8 Hours “n=100” |
2 nd 8 Hours “n=100” |
3rd 8 Hours “n=100” |
|||
|---|---|---|---|---|---|---|
| Group A | No. | % | No. | % | No. | % |
| non | 92 | 92 | 92 | 92 | 90 | 90 |
| 1-2 quadrant | 8 | 8 | 8 | 8 | 10 | 10 |
| 3 quadrants | 0 | 0 | 0 | 0 | 0 | 0 |
| 4 or all quadrants | 0 | 0 | 0 | 0 | 0 | 0 |
| Group B | - | - | - | - | - | - |
| non | 99 | 99 | 99 | 99 | 99 | 99 |
| 1-2 quadrant | 1 | 1 | 1 | 1 | 1 | 1 |
| 3 quadrants | 0 | 0 | 0 | 0 | 0 | 0 |
| 4 or all quadrants | 0 | 0 | 0 | 0 | 0 | 0 |
| Group C | - | - | - | - | - | - |
| non | 100 | 100 | 100 | 100 | 100 | 100 |
| 1-2 quadrant | 0 | 0 | 0 | 0 | 0 | 0 |
| 3 quadrants | 0 | 0 | 0 | 0 | 0 | 0 |
| 4 or all quadrants | 0 | 0 | 0 | 0 | 0 | 0 |
| P value | 0.006* | 0.006* | 0.008* | |||
| Chest X-ray Infiltration |
4th 8 Hours “n=100” |
5th 8 Hours “n=100” |
6th 8 Hours “n=100” |
|||
| Group A | No. | % | No. | % | No. | % |
| non | 87 | 87 | 83 | 83 | 80 | 80 |
| 1-2 quadrant | 7 | 7 | 7 | 7 | 7 | 7 |
| 3 quadrants | 5 | 5 | 8 | 8 | 10 | 10 |
| 4 or all quadrants | 1 | 1 | 2 | 2 | 3 | 3 |
| Group B | - | - | - | - | - | - |
| non | 95 | 95 | 93 | 93 | 91 | 91 |
| 1-2 quadrant | 2 | 2 | 1 | 1 | 1 | 1 |
| 3 quadrants | 3 | 3 | 5 | 5 | 7 | 7 |
| 4 or all quadrants | 0 | 0 | 1 | 1 | 1 | 1 |
| Group C | - | - | - | - | - | - |
| non | 97 | 97 | 95 | 95 | 94 | 94 |
| 1-2 quadrant | 1 | 1 | 1 | 1 | 1 | 1 |
| 3 quadrants | 2 | 2 | 4 | 4 | 5 | 5 |
| 4 or all quadrants | 0 | 0 | 0 | 0 | 0 | 0 |
| P value | 0.222 | 0.089 | 0.0684 | |||
| PaO2 mmHg |
1st 8 Hours “n=100” |
2 nd 8 Hours “n=100” |
3rd 8 Hours “n=100” |
|||
|---|---|---|---|---|---|---|
| Group A | No. | % | No. | % | No. | % |
| > 95 | 97 | 97 | 97 | 97 | 95 | 95 |
| 94-80 | 3 | 3 | 3 | 3 | 5 | 5 |
| 79-65 | 0 | 0 | 0 | 0 | 0 | 0 |
| <65 | 0 | 0 | 0 | 0 | 0 | 0 |
| Group B | - | - | - | - | - | - |
| > 95 | 100 | 100 | 100 | 100 | 99 | 99 |
| 94-80 | 0 | 0 | 0 | 0 | 1 | 1 |
| 79-65 | 0 | 0 | 0 | 0 | 0 | 0 |
| <65 | 0 | 0 | 0 | 0 | 0 | 0 |
| Group C | - | - | - | - | - | - |
| > 95 | 100 | 100 | 100 | 100 | 100 | 100 |
| 94-80 | 0 | 0 | 0 | 0 | 0 | 0 |
| 79-65 | 0 | 0 | 0 | 0 | 0 | 0 |
| <65 | 0 | 0 | 0 | 0 | 0 | 0 |
| P value | 0.436 | 0.431 | 0.946 | |||
| PaO2 mmHg | 4th 8 Hours | 5th 8 Hours | 6th 8 Hours | |||
| Group A | n=100 | % | n=100 | % | n=100 | % |
| > 95 | 80 | 80 | 74 | 74 | 70 | 70 |
| 94-80 | 6 | 6 | 6 | 6 | 7 | 7 |
| 79-65 | 10 | 10 | 10 | 10 | 10 | 10 |
| <65 | 4 | 4 | 10 | 10 | 13 | 13 |
| Group B | - | - | - | - | - | - |
| > 95 | 92 | 92 | 88 | 88 | 80 | 80 |
| 94-80 | 4 | 4 | 6 | 6 | 9 | 9 |
| 79-65 | 4 | 4 | 5 | 5 | 6 | 6 |
| <65 | 0 | 0 | 1 | 1 | 5 | 5 |
| Group C | - | - | - | - | - | - |
| > 95 | 94 | 94 | 90 | 90 | 86 | 86 |
| 94-80 | 3 | 3 | 6 | 6 | 7 | 7 |
| 79-65 | 3 | 3 | 4 | 4 | 5 | 5 |
| <65 | 0 | 0 | 0 | 0 | 2 | 2 |
| P value | 0.106 | 0.004* | 0.033* | |||
| PaCO2 mmHg |
1st 8 Hours “n=100” |
2 nd 8 Hours “n=100” |
3rd 8 Hours “n=100” |
|||
|---|---|---|---|---|---|---|
| Group A | No. | % | No. | % | No. | % |
| < 45 | 91 | 91 | 89 | 89 | 86 | 86 |
| 46-50 | 9 | 9 | 10 | 10 | 11 | 11 |
| 51-65 | 0 | 0 | 1 | 1 | 2 | 2 |
| >65 | 0 | 0 | 0 | 0 | 1 | 1 |
| Group B | - | - | - | - | - | - |
| < 45 | 100 | 100 | 100 | 100 | 98 | 98 |
| 46-50 | 0 | 0 | 0 | 0 | 2 | 2 |
| 51-65 | 0 | 0 | 0 | 0 | 0 | 0 |
| >65 | 0 | 0 | 0 | 0 | 0 | 0 |
| Group C | - | - | - | - | - | - |
| < 45 | 100 | 100 | 100 | 100 | 100 | 100 |
| 46-50 | 0 | 0 | 0 | 0 | 0 | 0 |
| 51-65 | 0 | 0 | 0 | 0 | 0 | 0 |
| >65 | 0 | 0 | 0 | 0 | 0 | 0 |
| P value | 0.0022* | 0.0007* | 0.0007* | |||
| PaCO2 mmHg |
4th 8 Hours “n=100” |
5th 8 Hours “n=100” |
6th 8 Hours “n=100” |
|||
| Group A | No. | % | No. | % | No. | % |
| < 45 | 80 | 80 | 75 | 75 | 70 | 70 |
| 46-50 | 13 | 13 | 14 | 14 | 16 | 16 |
| 51-65 | 4 | 4 | 6 | 6 | 7 | 7 |
| >65 | 3 | 3 | 5 | 5 | 7 | 7 |
| Group B | - | - | - | - | - | - |
| < 45 | 93 | 93 | 88 | 88 | 82 | 82 |
| 46-50 | 4 | 4 | 6 | 6 | 8 | 8 |
| 51-65 | 3 | 3 | 4 | 4 | 6 | 6 |
| >65 | 0 | 0 | 2 | 2 | 4 | 4 |
| Group C | - | - | - | - | - | - |
| < 45 | 94 | 94 | 90 | 90 | 88 | 88 |
| 46-50 | 4 | 4 | 5 | 5 | 6 | 6 |
| 51-65 | 2 | 2 | 4 | 4 | 5 | 5 |
| >65 | 0 | 0 | 1 | 1 | 1 | 1 |
| P value | 0.0772 | 0.081 | 0.071 | |||
| PH |
1st 8 Hours “n=100” |
2 nd 8 Hours “n=100” |
3rd 8 Hours “n=100” |
|||
|---|---|---|---|---|---|---|
| Group A | No. | % | No. | % | No. | % |
| > 7.35 | 98 | 98 | 94 | 94 | 91 | 91 |
| 7.34-7.25 | 2 | 2 | 5 | 5 | 7 | 7 |
| 7.24-7.20 | 0 | 0 | 1 | 1 | 2 | 2 |
| <7.20 | 0 | 0 | 0 | 0 | 0 | 0 |
| Group B | - | - | - | - | - | - |
| > 7.35 | 100 | 100 | 100 | 100 | 98 | 98 |
| 7.34-7.25 | 0 | 0 | 0 | 0 | 2 | 2 |
| 7.24-7.20 | 0 | 0 | 0 | 0 | 0 | 0 |
| <7.20 | 0 | 0 | 0 | 0 | 0 | 0 |
| Group C | - | - | - | - | - | - |
| > 7.35 | 100 | 100 | 100 | 100 | 99 | 99 |
| 7.34-7.25 | 0 | 0 | 0 | 0 | 1 | 1 |
| 7.24-7.20 | 0 | 0 | 0 | 0 | 0 | 0 |
| <7.20 | 0 | 0 | 0 | 0 | 0 | 0 |
| P value | 0.770 | 0.089 | 0.066 | |||
| PH |
4th 8 Hours “n=100” |
5th 8 Hours “n=100” |
6th 8 Hours “n=100” |
|||
| Group A | No. | % | No. | % | No. | % |
| > 7.35 | 85 | 85 | 79 | 79 | 70 | 70 |
| 7.34-7.25 | 8 | 8 | 10 | 10 | 13 | 13 |
| 7.24-7.20 | 5 | 5 | 7 | 7 | 11 | 11 |
| <7.20 | 2 | 2 | 4 | 4 | 6 | 6 |
| Group B | - | - | - | - | - | - |
| > 7.35 | 90 | 90 | 85 | 85 | 80 | 80 |
| 7.34-7.25 | 6 | 6 | 7 | 7 | 10 | 10 |
| 7.24-7.20 | 4 | 4 | 6 | 6 | 7 | 7 |
| <7.20 | 0 | 0 | 2 | 2 | 3 | 3 |
| Group C | - | - | - | - | - | - |
| > 7.35 | 92 | 92 | 87 | 87 | 82 | 82 |
| 7.34-7.25 | 6 | 6 | 6 | 6 | 8 | 8 |
| 7.24-7.20 | 2 | 2 | 5 | 5 | 8 | 8 |
| <7.20 | 0 | 0 | 2 | 2 | 2 | 2 |
| P value | 0.0872 | 0.823 | 0.462 | |||
4.3. Post-weaning Radiological Finding in Chest X-ray
Parenchymatous lung infiltration on the chest X-ray is monitored post-extubation every eight hours for 48 hours and is illustrated in Table 9.
| FEV1 |
1st 8 Hours “n=100” |
2 nd 8 Hours “n=100” |
3rd 8 Hours “n=100” |
|||
|---|---|---|---|---|---|---|
| Group A | No. | % | No. | % | No. | % |
| > 80% | 95 | 95 | 94 | 94 | 90 | 90 |
| 79-60% | 5 | 5 | 6 | 6 | 8 | 8 |
| 59-40% | 0 | 0 | 0 | 0 | 2 | 2 |
| <40% | 0 | 0 | 0 | 0 | 0 | 0 |
| Group B | - | - | - | - | - | - |
| > 80% | 100 | 100 | 100 | 100 | 98 | 98 |
| 79-60% | 0 | 0 | 0 | 0 | 2 | 2 |
| 59-40% | 0 | 0 | 0 | 0 | 0 | 0 |
| <40% | 0 | 0 | 0 | 0 | 0 | 0 |
| Group C | - | - | - | - | - | - |
| > 80% | 100 | 100 | 100 | 100 | 99 | 99 |
| 79-60% | 0 | 0 | 0 | 0 | 1 | 1 |
| 59-40% | 0 | 0 | 0 | 0 | 0 | 0 |
| <40% | 0 | 0 | 0 | 0 | 0 | 0 |
| P value | 0.093 | 0.068 | 0.0153 | |||
| FEV1 |
4th 8 Hours “n=100” |
5th 8 Hours “n=100” |
6th 8 Hours “n=100” |
|||
| Group A | No. | % | No. | % | No. | % |
| > 80% | 80 | 80 | 75 | 75 | 65 | 65 |
| 79-60% | 7 | 7 | 7 | 7 | 14 | 14 |
| 59-40% | 9 | 9 | 10 | 10 | 11 | 11 |
| <40% | 4 | 4 | 8 | 8 | 10 | 10 |
| Group B | - | - | - | - | - | - |
| > 80% | 92 | 92 | 85 | 85 | 78 | 78 |
| 79-60% | 6 | 6 | 7 | 7 | 10 | 10 |
| 59-40% | 2 | 2 | 6 | 6 | 8 | 8 |
| <40% | 0 | 0 | 2 | 2 | 4 | 4 |
| Group C | - | - | - | - | - | - |
| > 80% | 94 | 94 | 86 | 86 | 80 | 80 |
| 79-60% | 4 | 4 | 6 | 6 | 10 | 10 |
| 59-40% | 2 | 2 | 6 | 6 | 7 | 7 |
| <40% | 0 | 0 | 2 | 2 | 3 | 3 |
| P value | 0.069 | 0.206 | 0.186 | |||
| Percent of Reduction in FVC |
1st 8 Hours “n=100” |
2 nd 8 Hours “n=100” |
3rd 8 Hours “n=100” |
|||
|---|---|---|---|---|---|---|
| Group A | No. | % | No. | % | No. | % |
| > 80% | 96 | 96 | 93 | 93 | 90 | 90 |
| 79-60% | 4 | 4 | 7 | 7 | 10 | 10 |
| 59-40% | 0 | 0 | 0 | 0 | 0 | 0 |
| <40% | 0 | 0 | 0 | 0 | 0 | 0 |
| Group B | - | - | - | - | - | - |
| > 80% | 100 | 100 | 100 | 100 | 98 | 98 |
| 79-60% | 0 | 0 | 0 | 0 | 2 | 2 |
| 59-40% | 0 | 0 | 0 | 0 | 0 | 0 |
| <40% | 0 | 0 | 0 | 0 | 0 | 0 |
| Group C | - | - | - | - | - | - |
| > 80% | 100 | 100 | 100 | 100 | 99 | 99 |
| 79-60% | 0 | 0 | 0 | 0 | 1 | 1 |
| 59-40% | 0 | 0 | 0 | 0 | 0 | 0 |
| <40% | 0 | 0 | 0 | 0 | 0 | 0 |
| P value | 0.210 | 0.0353* | 0.012* | |||
| Percent of Reduction in FVC |
4th 8 Hours “n=100” |
5th 8 Hours “n=100” |
6th 8 Hours “n=100” |
|||
| Group A | No. | % | No. | % | No. | % |
| > 80% | 80 | 80 | 74 | 74 | 64 | 64 |
| 79-60% | 8 | 8 | 8 | 8 | 14 | 14 |
| 59-40% | 9 | 9 | 9 | 9 | 11 | 11 |
| <40% | 3 | 3 | 9 | 9 | 11 | 11 |
| Group B | - | - | - | - | - | - |
| > 80% | 91 | 91 | 83 | 83 | 76 | 76 |
| 79-60% | 6 | 6 | 8 | 8 | 10 | 10 |
| 59-40% | 3 | 3 | 6 | 6 | 9 | 9 |
| <40% | 0 | 0 | 3 | 3 | 5 | 5 |
| Group C | - | - | - | - | - | - |
| > 80% | 93 | 93 | 85 | 85 | 79 | 79 |
| 79-60% | 4 | 4 | 8 | 8 | 10 | 10 |
| 59-40% | 3 | 3 | 6 | 6 | 7 | 7 |
| <40% | 0 | 0 | 1 | 1 | 4 | 4 |
| P value | 0.181 | 0.137 | 0.248 | |||
There was a significant reduction in the number of patients who had multiple quadrant parenchymatous infiltration throughout the study in patients of both groups B and C compared to group A.
4.4. Post-weaning Dynamic Lung Parameters Collected by Spirometer
Percent of reduction of the forced expiratory volume in the first second from the total tidal volume was monitored post-extubation every eight hours for 48 hours and illustrated in Table 13.
Percent of reduction of the forced vital capacity was monitored post-extubation every eight hours for 48 hours and is illustrated in Table 14.
Maximum ventilatory ventilation was monitored post-extubation every eight hours for 48 hours and illustrated in Table 15.
There was a significant reduction in the number of patients who had marked limitation to FEV1, FVC and MVV in the study duration in patients of both groups B and C compared to group A.
Number of reintubated patients was monitored in the first 24 hours post-extubation and is illustrated in Table 16 and the total number of reintubated patients at the end of the study was monitored as shown in Table 17.
Total number of discharged patients from the ICU is illustrated in Table 18.
| MVV in L/min |
1st 8 Hours “n=100” |
2 nd 8 Hours “n=100” |
3rd 8 Hours “n=100” |
|||
|---|---|---|---|---|---|---|
| Group A | No. | % | No. | % | No. | % |
| > 80 L/min | 95 | 95 | 93 | 93 | 89 | 89 |
| 79-60 L/min | 5 | 5 | 7 | 7 | 11 | 11 |
| 59-40 L/min | 0 | 0 | 0 | 0 | 0 | 0 |
| <40 L/min | 0 | 0 | 0 | 0 | 0 | 0 |
| Group B | - | - | - | - | - | - |
| > 80 L/min | 100 | 100 | 98 | 98 | 96 | 96 |
| 79-60L/ min | 0 | 0 | 2 | 2 | 4 | 4 |
| 59-40 L/min | 0 | 0 | 0 | 0 | 0 | 0 |
| <40 L/min | 0 | 0 | 0 | 0 | 0 | 0 |
| Group C | - | - | - | - | - | - |
| > 80 L/min | 100 | 100 | 100 | 100 | 99 | 99 |
| 79-60L/ min | 0 | 0 | 0 | 0 | 1 | 1 |
| 59-40 L/min | 0 | 0 | 0 | 0 | 0 | 0 |
| <40 L/min | 0 | 0 | 0 | 0 | 0 | 0 |
| P value | 0.093 | 0.039* | 0.005* | |||
| MVV in L/min |
4th 8 Hours “n=100” |
5th 8 Hours “n=100” |
6th 8 Hours “n=100” |
|||
| Group A | No. | % | No. | % | No. | % |
| > 80 L/min | 81 | 81 | 78 | 78 | 69 | 69 |
| 79-60 L/min | 9 | 9 | 10 | 10 | 12 | 12 |
| 59-40 L/min | 6 | 6 | 6 | 6 | 11 | 11 |
| <40 L/min | 4 | 4 | 6 | 6 | 8 | 8 |
| Group B | - | - | - | - | - | - |
| > 80 L/min | 93 | 93 | 85 | 85 | 78 | 78 |
| 79-60L/ min | 4 | 4 | 8 | 8 | 10 | 10 |
| 59-40 L/min | 3 | 3 | 5 | 5 | 8 | 8 |
| <40 L/min | 0 | 0 | 2 | 2 | 4 | 4 |
| Group C | - | - | - | - | - | - |
| > 80 L/min | 94 | 94 | 87 | 87 | 79 | 79 |
| 79-60L/ min | 3 | 3 | 8 | 8 | 12 | 12 |
| 59-40 L/min | 3 | 3 | 4 | 4 | 6 | 6 |
| <40 L/min | 0 | 0 | 1 | 1 | 3 | 3 |
| P value | 0.143 | 0.433 | 0.498 | |||
| - | Group A (n=100) | Group B (n=100) | Group C (n=100) | P value | |||
|---|---|---|---|---|---|---|---|
| - | No. | % | No. | % | No. | % | - |
| Number of patients reintubated | 15 | 15.0 | 3 | 3.0 | 0 | 0.0 | 0.0456* |
| - | Group A (n=100) | Group B (n=100) | Group C (n=100) | P value | |||
|---|---|---|---|---|---|---|---|
| - | No. | % | No. | % | No. | % | - |
| Number of patients reintubated | 43 | 43.0 | 13 | 13.0 | 10 | 10.0 | 0.0013* |
| - | Group A (n=100) | Group B (n=100) | Group C (n=100) | P value | |||
|---|---|---|---|---|---|---|---|
| - | No. | % | No. | % | No. | % | - |
| Number of patients discharged from ICU | 57 | 57.0 | 87 | 87.0 | 90 | 90.0 | 0.0038* |
5. DISCUSSION
Actually, in this study, we used many tables showing fourteen indicators. These indicators could be divided into respiratory, hemodynamics, laboratory, radiological, and lung mechanics indicators. These indicators make the decision of re-intubation an objective decision as this decision was supported by all these indicators to make our results more reliable.
By reviewing results, we found that more than 80% of the patients had age below 56 years and more than 75% of them were males. This can be explained by the social rules in Saudi Arabia (KSA) where the percentage of male drivers are more common than female drivers and most of them start driving at a very young age; this is the reason why road traffic accidents are the second cause of deaths in KSA [9]. Regarding conscious level, patients who had GCS <10 were significantly higher in number in group A compared to group B and C. Considering the results of clinical respiratory parameters, patients who had respiratory rate > 35/min, SPO2 < 85%, parenchymatous lung infiltration >3 quadrants in chest Xray were significantly higher in group A compared to group B and C while no significant difference found in those parameters between group B and group C in the studied period. With respect to laboratory parameters measured by ABG, patients who had PaO2< 80 mm Hg, PCO2 > 50 mm Hg and PH of < 7.25 were significantly more in number in group A compared to group B and C while no significant difference found in those parameters between group B and group C in the studied period.
With respect to the dynamic lung volumes, parameters measured by Cosmed Pony FX Spirometer, FEV1<60%, FVC <60% and MVV < 60 Liter/min were significantly higher in group A compared to group B and C while no significant difference found in all those parameters between group B and group C patients in the studied period.
With respect to hemodynamic parameters, a significantly higher number of patients in group A had mean arterial blood pressure > 110 mm Hg, and pulse > 100/ min compared to group B and C, while no significant difference was found in those parameters between group B and group C patients in the studied period.
There were a significantly higher number of reintubated patients at the end of the studied period in group A (43 patients) compared to group B (13 patients) and group C (10 patients). There were a significantly higher number of patients discharged from the ICU in both groups B and C (87 and 90 patients respectively) compared to group A (57 patients only), while no significant difference was found between group B and C.
All the above recorded data could be explained by gradual retention of CO2 and development of the increasing level of hypoxemia during the studied period, which led to an increase in the number of patients who had deterioration of conscious level due to CO2 narcosis and gradual development of systemic and brain hypoxia; this occurs with gradual regression in all respiratory parameters and development of the hyperdynamic circulation with both tachycardia and hypertension due to increased sympathetic outflow due to hypercapnia and hypoxia. In fact, autopsy studies of braindead donors have shown diaphragm myofiber atrophy, a phenomenon attributed to complete diaphragm inactivity that is evident within the first 3 days of full ventilatory support [10]. A recent study measuring changes in diaphragmatic thickness and contractility by ultrasound found more than a 10% decrease in diaphragmatic thickness in nearly half of the patients during the first week of full ventilatory support which was associated with lower contractile activity [11]. Diaphragmatic contractile activity varied widely from patient to patient over the first week of full ventilatory support. Therefore, it is likely that our patients had varying levels of muscle dysfunction, although we have no direct measurements to support this theory. One of the major causes of the high success rate in both groups B&C was the early application of the full supportive ventilatory techniques, immediately after programmed extubation, which probably kept the upper airways open, improving ventilation and oxygenation, thus preventing the overload of the respiratory muscles, the development of atelectasis, ventilation / perfusion disorders, and respiratory distress in already fatigued muscles (diaphragm and respiratory muscles) from spontaneous breathing trials. Another important factor for respiratory muscle function is fatigue. The pathophysiological background of this fatigue is the early depletion of the ATP from the muscle fibers shortly after spontaneous breathing trials following prolonged full ventilatory support. Fatigue involves two components: high-frequency fatigue, which can be resolved in 10 - 15 min, and low-frequency fatigue, which can persist for more than 24 h. Unfortunately, the lack of physiological data in our study does not allow us to know why we have obtained such striking results. We can only speculate about the mechanisms for improvement on the basis of previous studies. In a study on healthy volunteers, Laghi et al. [12], found that diaphragm fatigue was mainly due to low-frequency fatigue and took more than 24 h for complete recovery. In the same study, the greatest recovery of the diaphragm occurred in the first hour of rest. However, they could not show whether the patients under MV developed low-frequency fatigue; they speculated that this was due to greater recruitment of the rib cage and expiratory muscles and patients being reconnected to the ventilator for clinical signs of distress before fatigue developed [13]. Probably, the work of breathing load imposed by spontaneous breathing trial is not high enough to fatigue the diaphragm in patients who pass it, but some of these patients could be weak enough to experience failure hours after extubation. Thus, we hypothesize that resting for 1 h with full ventilatory support could allow those patients at risk of fatigue to recover and rebuild ATP by their muscle fibers in the diaphragm and respiratory muscles to avoid respiratory distress in the post-extubation period.. Many studies prove the effectiveness of use of Noninvasive Ventilation (NIV) post-extubation to reduce failure of weaning and reconnection to mechanical ventilation in the first 48 hours post-extubation explain their results by giving the same physiological explanation done before. Susana R. Ornico et al., in 2013 [14] conducted a randomized, prospective, controlled, unblinded clinical study at a single center of a 24-bed adult general ICU in a university hospital for a 12-month period. Included patients met extubation criteria with at least 72 hours of mechanical ventilation due to acute respiratory failure and proved that NIV prevented 48 hours reintubation if applied immediately after elective extubation in patients with more than 3 days of full ventilatory support when compared with the control group (mask user group). Burns KE. et al., in 2009 [15] conducted a meta-analysis of the use of noninvasive ventilation to wean critically ill adults off invasive ventilation and obtain the same results and proved the significant effect of NIV in preventing reintubation after successful extubation in prolonged ventilated patients. (Ferrer M. et al., 2006 [16], Antonelli M. et al., in 2008 [17], Trevisan CE. in 2008 [18] and Ferrer M. et al., in 2009) [19].
Our study is considered one of the important studies comparing the use of NIV with MV with respect to the effect of reintubation and failure of weaning and results with the control group. But still, the major limitation of this study was the nature of the sample size as the social rules mentioned in the discussion make the sample restricted to young males and not the old age or pediatric age group. Therefore, we could not apply our results to all populations. So, there is a need to study the effect of those two maneuvers on prolonged ventilation in the two extremes of ages (old and pediatric ages). Another limitation of our study was the long list of exclusion criteria. So, we need more research works to study the effect of those maneuvers in comorbid patients with prolonged ventilation like COPD, diabetic, ischemic heart and hypertensive patients. The last limitation point is the traditional way of extubation used in our study and up till now, no agreement has been achieved among the researchers on one way of extubation so this means that the control group could vary between centers and researcher.
CONCLUSION
Use of either NIV every 12 hours for 24 hours or MV for one hour after fulfillment of weaning criteria reduces reintubation, re-ventilation and post-extubation respiratory failure and decreases the ICU stay in prolonged ventilated patients due to ARDS from severe lung trauma with no significant difference between them.
ETHICS APPROVAL AND CONSENT TO PARTICIPATE
King Abdulaziz research and the ethical committee (Saudi Arabia) approved the project. The registration number is ICU-19-20. The study was prospectively registered with Clinical trial registration number NCT04402320 in accordance with Non-Invasive and Invasive Ventilation Post Extubation.
HUMAN AND ANIMAL RIGHTS
No animals were used in this research. All human research procedures followed were in accordance with the ethical standards of the committee responsible for human experimentation (institutional and national), and with the Helsinki Declaration of 1975, as revised in 2013.
CONSENT FOR PUBLICATION
Written consent from the patient or from their 1st degree relative was obtained if the patient was intubated.
AVAILABILITY OF DATA AND MATERIAL
The datasets used and/or analyzed during the current study will be made available on reasonable request to the corresponding author [M.G. I. M. A.].
FUNDING
None.
CONFLICT OF INTEREST
The author declares no conflict of interest, financial or otherwise.
ACKNOWLEDGEMENTS
Declared none.