All published articles of this journal are available on ScienceDirect.

Comparative Study between the use of Ultrasonic Criteria of Weaning versus the Conventional Criteria of Weaning in Post-traumatic Acute Respiratory Distress Syndrome Patients who were Ventilated for a long Time
Abstract
Introduction:
Failure to wean and re-ventilation is a major problem in the intensive care unit (ICU). Thirty percent of ventilated patients experience weaning failure and are re-ventilated, especially patients who are ventilated for long durations. Ultrasound provides reliable data on lung parenchyma inflammation resolution and diaphragmatic contraction power, thereby assisting in deciding if the patient should be weaned and consequently reducing the percentage of weaning failure.
Aim of the Work:
To compare the ultrasonic criteria for weaning with the conventional criteria of weaning in patients with post-traumatic acute respiratory distress syndrome (ARDS) who were ventilated for a long time and assess their effect on the ICU stay duration.
Materials and Methods:
This was a prospective, double-blind study performed on 200 participants who were weaned from the ventilator after being ventilated for > 1 week due to respiratory failure. Respiratory failure in the patients was either due to severe lung contusion or post-traumatic ARDS. The patients were randomly and equally allocated in two groups of 100 patients each. Groups A and B comprised patients who were weaned from the ventilator using the conventional and ultrasound weaning criteria, respectively. All patients weaned from both groups were followed up for 6 days for signs of weaning failure and post-extubation respiratory failure. The number of patients who were re-ventilated and discharged from the ICU was recorded and compared in both groups.
Results:
Group A had a significantly higher number of patients who experienced deterioration in consciousness, tachypnea, desaturation, tachycardia, and hypertension in addition to showing chest X-ray infiltration and being re-ventilated than group B. Moreover, group A patients had a significantly longer ICU duration than group B patients.
Conclusion:
The use of the ultrasonic criteria for weaning reduces re-intubation, re-ventilation, and post-extubation respiratory failure. Additionally, its use also decreases the ICU stay in patients with post-traumatic ARDS who were ventilated for a long time.
1. INTRODUCTION
Post-extubation respiratory failure is a major problem in the intensive care unit (ICU), especially in patients ventilated for >1 week [1-16]. Severe lung contusion is the main reason for prolonged ventilation, and it is frequently associated with post-extubation respiratory failure [2-16], which causes 30% of ventilated patients to require re-ventilation after weaning. Post-weaning re-intubation is associated with a high mortality rate of up to 40% [3-16]. The high mortality is due to prolonged ICU stay and the development of VAP (ventilator-associated pneumonia) and diaphragm and respiratory muscle wasting from prolonged ventilation. [3-16]. When present together, these factors make the weaning decision extremely challenging.[5, 7-16] Ultrasound is highly advantageous in reducing the percentage of weaning failure in such patients. It can give precise and reliable data about the resolution of lung parenchyma inflammation and helps evaluate the diaphragmatic contraction strength [8-10]. These data can help the intensivist determine the best time for weaning the patient from the ventilator and markedly reduce the percentage of re-intubation and re-ventilation [10-13]. Most studies have identified post-extubation diaphragmatic dysfunction as the cause of weaning failure. Therefore, research focused on evaluating the patient’s diaphragmatic contraction using chest ultrasound before deciding if the patient had to be weaned to reduce weaning failure [14-16].
2. MATERIALS AND METHODS
This prospective, double-blind study (using randomization sequence Excel 2007 to allocate members of the two groups, the data collectors receive the results of both groups as numerical data and neither the participants nor the researcher knows which treatment or intervention participants are receiving in both groups until the clinical trial is over) included 200 patients who were admitted to the Surgical ICU of King Abdul-Aziz Specialist Hospital in Taif, Kingdom of Saudi Arabia (KSA) between February 2022 and March 2023. The study population included patients with respiratory failure and acute respiratory distress syndrome (ARDS) due to severe lung contusion. The following inclusion criteria were applied: 1) adult patients aged between 18-65 years, 2) hypoxic index of < 200, 3) bilateral, all quadrant parenchymatous lung infiltration, and 4) SPO2 < 90% with the use of an oxygen mask with a bag and 15-liter oxygen flow to maintain the previous saturation level. All patients had severe lung contusions diagnosed by high-resolution chest computerized tomography and were ventilated for > 1 week. Patients were randomly allocated in one of two groups; each group contained 100 patients. The randomization sequence was created using Excel 2007 (Microsoft, Redmond, WA, USA) with a 1:1 allocation ratio using random block sizes of 2 and 4 by an independent doctor. Therefore, sequence generation and type of randomization were expressed simultaneously [16]. Group A patients, considered the control group, were weaned using the conventional weaning criteria; whereas, group B patients were weaned using the ultrasonic criteria for weaning.
The conventional criteria for weaning included: 1) complete consciousness, 2) hemodynamically stable without inotropic support, 3) a hypoxic index (PAO2/FIO2) of >200 calculated from the arterial blood gases (ABG) and FIO2, 4) arterial blood bicarbonate level of >20 mmol/l, 5) hemoglobin level of >10 mg/dL, 6) less than one quadrant parenchymatous infiltration in each lung on the chest x-ray based on the Murray score, and 7) (Table 1) rapid, shallow breathing with a breathing index of <105 [16]. The ultrasonic criteria for weaning in our study were classified into two main indicators. The first and most important criterion was the assessment of diaphragmatic contraction. The strength of diaphragmatic contraction was assessed by measuring diaphragmatic excursion, diaphragm thickening fraction, presence of paradoxical movement, and the difference between the right and left cupola of the diaphragm (the right side is always higher because of the presence of the liver). The diaphragmatic excursion (DE) was measured as the distance the diaphragm can move during the respiratory cycle, and the diaphragm thickening fraction (DTF), which reflects diaphragmatic thickness variation during respiratory effort, was calculated as the diaphragmatic thickness at the end-inspiration/thickness at the end-expiration [7, 8]. Diaphragmatic ultrasound can assess these two parameters using the M-mode, where the probe is placed in the right midline of the axilla and the left axillary posterior line when the patient is placed in a supine position [9]. Proportional assist ventilation allows diaphragmatic effort to be estimated accurately [10]. Paradoxical movement is defined as intra-thoracic diaphragmatic movement during inspiration and a reverse movement during expiration. In our study, all group B patients were weaned at a cut-off of 1 cm of DE with no paradoxical movement; moreover, the DTF of both sides was between 0.7-1.5 in males and 0.6-1.6 in females. While the upper acceptable limit for the differences between the sides was 1 mm in females and 0.9 mm in males. The second ultrasonic criterion was the ultrasonic assessment of parenchymatous lung infiltration resolution. Group B patients were weaned after the resolution of three ultrasonic findings: (1) disappearance of the alveolo-interstitial syndrome, defined as increased B-line artifacts; and (2) disappearance of the peripheral parenchymal lesion, defined as the presence of C-lines—hypo-echoic sub-pleural focal images with or without pleural line gap and (3) disappearance of dynamic air-bronchogram. The chest ultrasound was performed by a single radiologist for all the patients in group B to eliminate subjective differences.
| Score of Severity | 0 | 1 | 2 | 3 | 4 |
|---|---|---|---|---|---|
| Chest X-ray | Non | 1 quadrant infiltrated | 2 quadrants infiltrated | 3 quadrants infiltrated | 4 quadrants infiltrated |
| Age in Years | Group A (n=100) | Group B (n=100) | P-value |
| 18-30 | 23 | 24 | 0.898 |
| 31-45 | 42 | 43 | |
| 46-55 | 24 | 21 | |
| 56-65 | 11 | 12 | |
| Sex | Group A (n=100) | Group B (n=100) | P-value |
| Male | 71 | 73 | 0.944 |
| Female | 29 | 27 |
All patients who were weaned from both groups followed our routine protocol, which included nebulization with a Ventolin and epinephrine racemic mixture every 8 hours for 48 hours, chest physical therapy (CPT) every 6 hours for 48 hours, including clapping percussion with mechanical vibration and suction plus huffing or coughing, and postural drainage if there was atelectasis seen on our routine, daily chest x-ray [16]. All patients were followed up for six days and the following clinical data were recorded: consciousness level using the Glasgow coma scale (GCS); respiratory rate; oxygen saturation using plethysmography for SPO2; hemodynamics, including mean arterial blood pressure and pulse. The radiological data recorded included chest X-ray using the clinical parameters of the Murray score for evaluation of the parenchymatous lung infiltrate size [3-16]. The following laboratory data were recorded: arterial blood gases (ABG) for monitoring arterial PH, arterial blood oxygen (PaO2), and arterial blood carbon dioxide (PaCO2). Both clinical radiological and laboratory data were recorded every day after extubation [16]. The number of patients re-intubated from both groups was also recorded every day. Moreover, the number of patients discharged from the ICU at the end of the study period from both groups was recorded and compared [16].
This study was approved by the King Abdul-Aziz Research and Ethical Committee. Written consent from the patient or their immediate relative was obtained if the patient was intubated.
Exclusion criteria were age <18 years or >65 years, patients had obstructive lung disease (COPD) patient, post cardiac arrest, patients had diabetes Mellitus, hypertension, renal failure and patients had any type of myopathy.
2.1. Statistical Analysis
The data was collected and entered into the personal computer. Statistical analysis was done using Statistical Package for Social Sciences (SPSS/version 21) software. For categorized parameters chi square test was used. The level of significance was 0.05. Statistical analysis was done between Group A (which is considered the control group) and Group B.
2.2. Sample Size
The sample size and should depend on the research context, including the researcher’s objectives and proposed analyses.
The following formula was used to calculate the required sample size in this study;
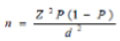 |
Where n is the sample size, Z is the statistic corresponding to the level of confidence, P is expected prevalence, and d is precision (corresponding to effect size). The level of confidence was 95%. By using this equation, the sample size was 100 cases in each group (i.e. 200 cases in the two groups).
P-value considered significant if < 0.05
3. RESULTS
3.1. As Regards the Post-weaning Conscious Level [16]
The conscious level was monitored post-extubation every day as illustrated in Table 3 [16].
3.2. Post-extubation Parameters
- Respiratory rate recorded post-extubation every day in Table 4.
- Arterial oxygen saturation is recorded in Table 7.
- Partial pressure of oxygen recorded in Table 9.
- Carbon dioxide is recorded in Table 10.
- PH recorded in Table 11.
- Mean arterial blood pressure is recorded in Table 5.
- Pulse recorded in Table 6.
| Conscious level (GCS) |
1st day “n=100” |
2nd day “n=100” |
3rd day “n=100” |
|||
| Group A | No. | % | No. | % | No. | % |
| 3-5 | 0 | 0 | 0 | 0 | 0 | 0 |
| 6-10 | 11 | 11 | 9 | 9 | 8 | 8 |
| 11-15 | 89 | 89 | 91 | 91 | 92 | 92 |
| Group B | - | - | - | - | - | - |
| 3-5 | 0 | 0 | 0 | 0 | 0 | 0 |
| 6-10 | 0 | 0 | 0 | 0 | 1 | 1 |
| 11-15 | 100 | 100 | 100 | 100 | 99 | 99 |
| P-value | 0.0058* | 0.0013* | 0.00037* | |||
| Conscious level (GCS) |
4th day “n=100” |
5th day “n=100” |
6th day “n=100” |
|||
| Group A | No | % | No | % | No | % |
| 3-5 | 1 | 1 | 3 | 3 | 5 | 5 |
| 6-10 | 26 | 26 | 30 | 30 | 36 | 36 |
| 11-15 | 73 | 73 | 67 | 67 | 59 | 59 |
| Group B | - | - | - | - | - | - |
| 3-5 | 0 | 0 | 0 | 0 | 0 | 0 |
| 6-10 | 4 | 4 | 7 | 7 | 9 | 9 |
| 11-15 | 96 | 96 | 93 | 93 | 91 | 91 |
| P-value | 0.003* | 0.005* | 0.007* | |||
| Respiratory Rate (breath/min) |
1st day “n=100” |
2 nd day “n=100” |
3rd day “n=100” |
|||
| Group A | No. | % | No. | % | No. | % |
| < 20 | 9 | 9 | 9 | 9 | 4 | 4 |
| 21-25 | 57 | 57 | 59 | 59 | 52 | 52 |
| 26-35 | 30 | 30 | 27 | 27 | 35 | 35 |
| >35 | 4 | 4 | 5 | 5 | 9 | 9 |
| Group B | - | - | - | - | - | - |
| < 20 | 28 | 28 | 26 | 26 | 22 | 22 |
| 21-25 | 41 | 41 | 41 | 41 | 40 | 40 |
| 26-35 | 30 | 30 | 31 | 31 | 35 | 35 |
| >35 | 1 | 1 | 2 | 2 | 3 | 3 |
| P-value | 0.0002* | 0.0001* | 0.00001* | |||
| Respiratory Rate (breath/min) |
4th day “n=100” |
5th day “n=100” |
6th day “n=100” |
|||
| Group A | No. | % | No. | % | No. | % |
| < 20 | 3 | 3 | 3 | 3 | 4 | 4 |
| 21-25 | 54 | 54 | 53 | 53 | 50 | 50 |
| 26-35 | 32 | 32 | 30 | 30 | 25 | 25 |
| >35 | 11 | 11 | 14 | 14 | 21 | 21 |
| Group B | - | - | - | - | - | - |
| < 20 | 26 | 26 | 26 | 26 | 27 | 27 |
| 21-25 | 38 | 38 | 38 | 38 | 37 | 37 |
| 26-35 | 34 | 34 | 32 | 32 | 30 | 30 |
| >35 | 2 | 2 | 4 | 4 | 6 | 6 |
| P-value | 0.00034* | 0.00022* | 0.00059* | |||
| Mean Arterial Blood Pressure in (mmHg) |
1st day “n=100” |
2 nd day “n=100” |
3rd day “n=100” |
|||
| Group A | No. | % | No. | % | No. | % |
| < 100 | 26 | 26 | 20 | 20 | 17 | 17 |
| 101-110 | 48 | 48 | 48 | 48 | 41 | 41 |
| >110 | 26 | 26 | 32 | 32 | 42 | 42 |
| Group B | - | - | - | - | - | - |
| < 100 | 43 | 43 | 43 | 43 | 42 | 42 |
| 101-110 | 52 | 52 | 51 | 51 | 50 | 50 |
| >110 | 5 | 5 | 6 | 6 | 8 | 8 |
| P-value | 0.0002* | 0.0005* | 0.0001* | |||
| Mean Arterial Blood Pressure in (mmHg) |
4th day “n=100” |
5th day “n=100” |
6th day “n=100” |
|||
| Group A | No. | % | No. | % | No. | % |
| < 100 | 16 | 16 | 17 | 17 | 15 | 15 |
| 101-110 | 44 | 44 | 42 | 42 | 32 | 32 |
| >110 | 40 | 40 | 41 | 41 | 53 | 53 |
| Group B | - | - | - | - | - | - |
| <100 | 40 | 40 | 41 | 41 | 42 | 42 |
| 101-110 | 50 | 50 | 49 | 49 | 49 | 49 |
| >110 | 10 | 10 | 10 | 10 | 9 | 9 |
| P-value | 0.00021* | 0.00029* | 0.00023* | |||
| Pulse (beat/min) |
1st day “n=100” |
2 nd day “n=100” |
3rd day “n=100” |
|||
| Group A | No. | % | No. | % | No. | % |
| > 80 | 27 | 27 | 25 | 25 | 17 | 17 |
| 81-100 | 51 | 51 | 52 | 52 | 52 | 52 |
| >100 | 22 | 22 | 23 | 23 | 31 | 31 |
| Group B | - | - | - | - | - | - |
| > 80 | 58 | 58 | 56 | 56 | 50 | 50 |
| 81-100 | 36 | 36 | 36 | 36 | 40 | 40 |
| >100 | 6 | 6 | 8 | 8 | 10 | 10 |
| P-value | 0.0002* | 0.0002* | 0.0002* | |||
| Pulse (beat/min) |
4th day “n=100” |
5th day “n=100” |
6th day “n=100” |
|||
| Group A | No. | % | No. | % | No. | % |
| > 80 | 21 | 21 | 22 | 22 | 23 | 23 |
| 81-100 | 46 | 46 | 46 | 46 | 37 | 37 |
| >100 | 33 | 33 | 32 | 32 | 40 | 40 |
| Group B | - | - | - | - | - | - |
| > 80 | 50 | 50 | 51 | 51 | 53 | 53 |
| 81-100 | 36 | 36 | 35 | 35 | 33 | 33 |
| >100 | 14 | 14 | 14 | 14 | 14 | 14 |
| P-value | 0.00031* | 0.00028* | 0.00002* | |||
| Saturation (SPO2%) |
1st day “n=100” |
2 nd day “n=100” |
3rd day “n=100” |
|||
| Group A | No. | % | No. | % | No. | % |
| > 95 | 60 | 60 | 56 | 56 | 54 | 54 |
| 94-85 | 37 | 37 | 40 | 40 | 42 | 42 |
| 84-80 | 2 | 2 | 3 | 3 | 3 | 3 |
| <80 | 1 | 1 | 1 | 1 | 1 | 1 |
| Group B | - | - | - | - | - | - |
| > 95 | 87 | 87 | 86 | 86 | 85 | 85 |
| 94-85 | 11 | 11 | 11 | 11 | 12 | 12 |
| 84-80 | 1 | 1 | 2 | 2 | 2 | 2 |
| <80 | 1 | 1 | 1 | 1 | 1 | 1 |
| P-value | 0.0002* | 0.0002* | 0.0002* | |||
| Saturation (SPO2%) |
4th day “n=100” |
5th day “n=100” |
6th day “n=100” |
|||
| Group A | No. | % | No. | % | No. | % |
| > 95 | 52 | 52 | 53 | 53 | 52 | 52 |
| 94-85 | 30 | 30 | 25 | 25 | 18 | 18 |
| 84-80 | 14 | 14 | 13 | 13 | 17 | 17 |
| <80 | 4 | 4 | 9 | 9 | 13 | 13 |
| Group B | - | - | - | - | - | - |
| > 95 | 84 | 84 | 83 | 83 | 82 | 82 |
| 94-85 | 10 | 10 | 7 | 7 | 5 | 5 |
| 84-80 | 5 | 5 | 7 | 7 | 6 | 6 |
| <80 | 1 | 1 | 3 | 3 | 7 | 7 |
| P-value | 0.00037* | 0.0021* | 0.00031* | |||
| Chest X Ray Infiltration |
1st day “n=100” |
2 nd day “n=100” |
3rd day “n=100” |
|||
| Group A | No. | % | No. | % | No. | % |
| Non | 94 | 94 | 93 | 93 | 92 | 92 |
| 1-2 quadrant | 6 | 6 | 7 | 7 | 8 | 8 |
| 3 quadrants | 0 | 0 | 0 | 0 | 0 | 0 |
| 4 or all quadrants | 0 | 0 | 0 | 0 | 0 | 0 |
| Group B | - | - | - | - | - | - |
| Non | 99 | 99 | 98 | 98 | 98 | 98 |
| 1-2 quadrant | 1 | 1 | 2 | 2 | 2 | 2 |
| 3 quadrants | 0 | 0 | 0 | 0 | 0 | 0 |
| 4 or all quadrants | 0 | 0 | 0 | 0 | 0 | 0 |
| P-value | 0.006* | 0.006* | 0.008* | |||
| Chest X Ray Infiltration |
4th day “n=100” |
5th day “n=100” |
6th day “n=100” |
|||
| Group A | No. | % | No. | % | No. | % |
| Non | 90 | 90 | 88 | 88 | 85 | 85 |
| 1-2 quadrant | 5 | 5 | 6 | 6 | 7 | 7 |
| 3 quadrants | 4 | 4 | 4 | 4 | 5 | 5 |
| 4 or all quadrants | 1 | 1 | 2 | 2 | 3 | 3 |
| Group B | - | - | - | - | - | - |
| Non | 98 | 98 | 97 | 97 | 96 | 96 |
| 1-2 quadrant | 2 | 2 | 3 | 3 | 4 | 4 |
| 3 quadrants | 0 | 0 | 0 | 0 | 0 | 0 |
| 4 or all quadrants | 0 | 0 | 0 | 0 | 0 | 0 |
| P-value | 0.007* | 0.008* | 0.009* | |||
| PaO2 mmHg |
1st day “n=100” |
2 nd day “n=100” |
3rd day “n=100” |
|||
| Group A | No. | % | No. | % | No. | % |
| > 95 | 95 | 95 | 94 | 94 | 92 | 92 |
| 94-80 | 5 | 5 | 5 | 5 | 5 | 5 |
| 79-65 | 0 | 0 | 1 | 1 | 2 | 2 |
| <65 | 0 | 0 | 0 | 0 | 1 | 1 |
| Group B | - | - | - | - | - | - |
| > 95 | 99 | 99 | 99 | 99 | 99 | 99 |
| 94-80 | 1 | 1 | 1 | 1 | 1 | 1 |
| 79-65 | 0 | 0 | 0 | 0 | 0 | 0 |
| <65 | 0 | 0 | 0 | 0 | 0 | 0 |
| P-value | 0.041* | 0.039* | 0.037* | |||
| PaO2 mmHg | 4th day | 5th day | 6th day | |||
| Group A | n=100 | % | n=100 | % | n=100 | % |
| > 95 | 81 | 81 | 75 | 75 | 73 | 73 |
| 94-80 | 6 | 6 | 6 | 6 | 7 | 7 |
| 79-65 | 10 | 10 | 10 | 10 | 10 | 10 |
| <65 | 3 | 3 | 9 | 9 | 10 | 10 |
| Group B | - | - | - | - | - | - |
| > 95 | 95 | 95 | 91 | 91 | 90 | 90 |
| 94-80 | 4 | 4 | 6 | 6 | 6 | 6 |
| 79-65 | 1 | 1 | 3 | 3 | 4 | 4 |
| <65 | 0 | 0 | 0 | 0 | 0 | 0 |
| P-value | 0.036* | 0.014* | 0.033* | |||
| PaCO2 mmHg |
1st day “n=100” |
2 nd day “n=100” |
3rd day “n=100” |
|||
| Group A | No. | % | No. | % | No. | % |
| < 45 | 89 | 89 | 87 | 87 | 84 | 84 |
| 46-50 | 10 | 10 | 11 | 11 | 10 | 10 |
| 51-65 | 1 | 1 | 1 | 1 | 3 | 3 |
| >65 | 0 | 0 | 1 | 1 | 3 | 3 |
| Group B | - | - | - | - | - | - |
| < 45 | 99 | 99 | 99 | 99 | 97 | 97 |
| 46-50 | 1 | 1 | 1 | 1 | 2 | 2 |
| 51-65 | 0 | 0 | 0 | 0 | 1 | 1 |
| >65 | 0 | 0 | 0 | 0 | 0 | 0 |
| P-value | 0.0022* | 0.0007* | 0.0007* | |||
| PaCO2 mmHg |
4th day “n=100” |
5th day “n=100” |
6th day “n=100” |
|||
| Group A | No. | % | No. | % | No. | % |
| < 45 | 78 | 78 | 74 | 74 | 71 | 71 |
| 46-50 | 12 | 12 | 15 | 15 | 15 | 15 |
| 51-65 | 6 | 6 | 7 | 7 | 8 | 8 |
| >65 | 4 | 4 | 4 | 4 | 6 | 6 |
| Group B | - | - | - | - | - | - |
| < 45 | 96 | 96 | 92 | 92 | 90 | 82 |
| 46-50 | 4 | 4 | 6 | 6 | 6 | 6 |
| 51-65 | 0 | 0 | 2 | 2 | 4 | 4 |
| >65 | 0 | 0 | 0 | 0 | 0 | 0 |
| P-value | 0.015* | 0.023* | 0.032* | |||
| PH |
1st day “n=100” |
2 nd day “n=100” |
3rd day “n=100” |
|||
| Group A | No. | % | No. | % | No. | % |
| > 7.35 | 95 | 95 | 92 | 92 | 90 | 90 |
| 7.34-7.25 | 3 | 3 | 4 | 4 | 5 | 5 |
| 7.24-7.20 | 1 | 1 | 2 | 2 | 3 | 3 |
| <7.20 | 1 | 1 | 2 | 2 | 2 | 2 |
| Group B | - | - | - | - | - | - |
| > 7.35 | 98 | 98 | 98 | 98 | 97 | 97 |
| 7.34-7.25 | 2 | 2 | 2 | 2 | 3 | 3 |
| 7.24-7.20 | 0 | 0 | 0 | 0 | 0 | 0 |
| <7.20 | 0 | 0 | 0 | 0 | 0 | 0 |
| P-value | 0.66 | 0.076 | 0.056 | |||
| PH |
4th day “n=100” |
5th day “n=100” |
6th day “n=100” |
|||
| Group A | No. | % | No. | % | No. | % |
| > 7.35 | 84 | 84 | 78 | 78 | 72 | 72 |
| 7.34-7.25 | 9 | 9 | 11 | 11 | 11 | 11 |
| 7.24-7.20 | 4 | 4 | 8 | 8 | 10 | 10 |
| <7.20 | 3 | 3 | 3 | 3 | 7 | 7 |
| Group B | - | - | - | - | - | - |
| > 7.35 | 96 | 96 | 95 | 95 | 90 | 90 |
| 7.34-7.25 | 4 | 4 | 5 | 5 | 10 | 10 |
| 7.24-7.20 | 0 | 0 | 0 | 0 | 0 | 0 |
| <7.20 | 0 | 0 | 0 | 0 | 0 | 0 |
| P-value | 0.015* | 0.024* | 0.033* | |||
| - | Group A (n=100) | Group B (n=100) | P-value | ||
| - | No. | % | No. | % | - |
| Number of patients reintubated | 10 | 10.0 | 2 | 2.0 | 0.0476* |
| - | Group A (n=100) | Group B (n=100) | P-value | ||
| - | No. | % | No. | % | - |
| Number of patients reintubated | 40 | 40.0 | 10 | 10.0 | 0.00129* |
| - | Group A (n=100) | Group B (n=100) | P-value | ||
| - | No. | % | No. | % | - |
| Number of patients discharged from ICU | 57 | 57.0 | 87 | 87.0 | 0.00391* |
There was a significant increase in the number of patients who had post-extubation respiratory failure in group A compared to those in group B manifested by higher numbers of patients who showed deterioration in consciousness, tachypnea, tachycardia, hypertension and respiratory acidosis.
4. DISCUSSION
Eleven parameters were evaluated in the present study, including respiratory, hemodynamic, laboratory, and radiological data [16]. These parameters make the re-intubation decision objective rather than subjective, thereby increasing the reliability of our results [16].
Our results were also affected by the social rules of the study’s location. In the KSA, male drivers are more common than female drivers, and most males start driving at a very young age. These factors make road traffic accidents the second leading cause of death in the KSA [16]. Therefore, the demographic data (Table 2) of our study showed that >80% of patients were aged <56 years, and >75% of them were males. These statistics may vary from country to country.
Regarding the consciousness level monitored in the study [16], the number of patients with a GCS of <10 was significantly higher in group A compared to group B. Regarding the results of the clinical respiratory parameters [16], group A had a significantly higher number ofpatients with a respiratory rate >35/min, SPO2 <85%, and parenchymatous lung infiltration >3 quadrants on chest x-ray compared to group B. Regarding the laboratory parameters measured by ABG, group A had a significantly higher number of patients with a PaO2<80 mmHg, PCO2 >50 mmHg, and PH of <7.25 compared to group B.
There was a significantly higher number of patients who were re-intubated patients between the two groups. The number of patients who were re-intubated was recorded both at the end of the 3rd day of the study and the end of the study period. The number of patients who were discharged from the ICU at the end of the study period was significantly higher in group B (n=87) compared to group A (n=57).
Scientifically, the recorded data could be explained by significant gradual regression in the lung mechanics in both groups of patients. This reduction in pulmonary function led to a concomitant gradual decrease in the consciousness level due to progressive hypoxemia and hypercapnia in both groups. Additionally, it led to a gradual rise in the number of patients who experienced tachypnea; hypoxemia; hypercapnia; respiratory acidosis, which was detected by SPO2, PH, PCO2, and PO2 in ABG; hyperdynamic circulation, which manifested as tachycardia and hypertension due to the hypoxemia and hypercapnia; and an increase in the parenchymatous lung infiltration on chest x-ray.
This gradual decrease in the lung mechanics and pulmonary function tests in group A could be explained by the high sensitivity of the ultrasound data on lung parenchyma contusion resolution and diaphragmatic contraction power recorded in group B compared to the conventional weaning criteria in group A, which depended on subjective clinical data. Notably, this highlights a comparison between the use of less subjective data recorded using an ultrasound and more subjective data recorded by clinical examination.
Our results support those of numerous studies done in this field. Llamas-Álvarez et al. conducted a [8], 16] systematic review and meta-analysis on the use of ultrasound in the weaning decision, and their review included 19 studies involving 1,071 people. In their study, ultrasound was used to assess the DTF and resolution of lung parenchyma inflammation. The study proved that ultrasound helps predict weaning outcomes; however, its accuracy may vary depending on the patient subpopulation. Li et al. in 2018 [17] performed another meta-analysis of 13 studies that included 742 participants. In these studies, both DE and DTF were measured to determine the appropriate time for weaning from the ventilator. They concluded that diaphragmatic ultrasonography is a promising tool for predicting re-intubation within 48 hours of extubation. However, due to heterogeneities among the included studies, large-scale studies are warranted to confirm their findings. Another systematic review and meta-analysis by Zhicheng Qian et al. in the same year [10, 17] involved 436 patients, and they measured both DE and DTF using chest ultrasound in patients who had repeated weaning failure. They found that DE and DTF measured by ultrasound are good diagnostic performance indicators to predict weaning outcomes; however, their limitations included a high heterogeneity among the studies. In 2020, Mostafa Ibrahim Elshazly et al. conducted a study [18] on 63 patients. The study included two groups—one group underwent only chest physiotherapy, and the other underwent chest ultrasound chest to measure both DE and DTF. They found that diaphragmatic ultrasonography was a promising tool for predicting extubation outcomes for mechanically ventilated patients. Zhang et al. in 2020 [19] studied the results of ultrasound weaning criteria by measuring the DE and DTF in 25 patients who were ventilated due to chronic obstructive pulmonary disease patients (COPD) with respiratory failure and proved that measuring both DE and DTF improves the potential predictors of the extubation outcome in mechanically ventilated patients with COPD. Yet another study performed by El Gharib et al. in 2022 [20] examined every single parameter in chest ultrasound, including DE, DTF, DE, and DTF combined, and lung parenchyma inflammation resolution among patients with repeated weaning failure. They highlighted the importance of including all ultrasound parameters in the weaning decision; however, they could not highlight the impact of excluding clinical parameters of weaning. Nevertheless, some authors found no significant difference between the use of ultrasonic criteria for weaning and the conventional criteria for weaning.
Vivier et al. in 2019 [21] performed a multicenter, prospective study that evaluated DT and DTF in 191 patients at high risk of re-intubation over 20 months and found no significant value of using the diaphragmatic ultrasound data in the weaning decision. Contrarily, we found chest ultrasound to be a very useful tool in the weaning decision, and a majority of the surgeons working in our ward support this opinion.
Our study had some limitations. First, our sample’s demographics represented our social rules as mentioned previously; hence, the generalizability of our results to other societies is questionable. Second, our study had a small sample size. Third, we used the ultrasound criteria of weaning only in patients with post-traumatic ARDS who were ventilated for > 1 week and not for patients ventilated because of other medical or surgical reasons. Further studies are needed to assess the effect of the use of the ultrasonic criteria of weaning on different causes of respiratory failure. Additionally, a strict protocol should be available that combines both the clinical and ultrasonic weaning criteria for best results and to decrease the percentage of weaning failures, especially in patients ventilated for prolonged durations.
CONCLUSION
The use of the ultrasonic criteria for weaning reduces re-intubation, re-ventilation, and post-extubation respiratory failure. Additionally, its use also decreases the ICU stay in patients with post-traumatic ARDS who were ventilated for a long time.
LIST OF ABBREVIATIONS
| ARDS | = Acute Respiratory Distress Syndrome |
| ICU | = Intensive Care Unit |
| KSA | = Kingdom of Saudi Arabia |
| VAP | = Ventilator-associated Pneumonia |
| DE | = Diaphragmatic Excursion |
| DTF | = Diaphragm Thickening Fraction |
| CPT | = Chest Physical Therapy |
| COPD | = Chronic Obstructive Pulmonary Disease Patients |
ETHICS APPROVAL AND CONSENT TO PARTICIPATE
This study was approved by the King Abdul-Aziz Research and Ethical Committee.
HUMAN AND ANIMAL RIGHTS
No animals were used in this research. All procedures performed in studies involving human participants were in accordance with the ethical standards of institutional and/or research committee and with the 1975 Declaration of Helsinki, as revised in 2013.
CONSENT FOR PUBLICATION
Informed consent was obtained from all participants
STANDARDS OF REPORTING
STROBE guidelines were followed.
AVAILABILITY OF DATA AND MATERIALS
The data and supportive information is available within the article.
FUNDING
None.
CONFLICT OF INTEREST
The author declares no conflict of interest financial or otherwise.
ACKNOWLEDGEMENTS
We appreciate the linguistic assistance provided by TopEdit (www.topeditsci.com) during the preparation of this manuscript.