RESEARCH ARTICLE


Color Spectrographic Analysis of Respiratory Sounds: A Promising Technology for Respiratory Monitoring


Daniel J. Doyle1, *
iD

1 Department of General Anesthesiology, Cleveland Clinic Lerner College of Medicine, Cleveland, OH, Abu Dhabi


Article Metrics

CrossRef Citations:
1
Total Statistics:

Full-Text HTML Views: 5569
Abstract HTML Views: 1544
PDF Downloads: 981
Total Views/Downloads: 8094
Unique Statistics:

Full-Text HTML Views: 2512
Abstract HTML Views: 678
PDF Downloads: 719
Total Views/Downloads: 3909


Creative Commons License
© 2020 Daniel J. Doyle.

open-access license: This is an open access article distributed under the terms of the Creative Commons Attribution 4.0 International Public License (CC-BY 4.0), a copy of which is available at: (https://creativecommons.org/licenses/by/4.0/legalcode). This license permits unrestricted use, distribution, and reproduction in any medium, provided the original author and source are credited.

* Address correspondence to this author at the Department of General Anesthesiology, Cleveland Clinic Lerner College of Medicine, Cleveland, OH, USA, E-mail: djdoyle@hotmail.com


Abstract

Background:

The need for reliable respiratory monitoring has increased in recent years with the frequent use of opioids for perioperative pain management as well as a high prevalence of patients suffering from respiratory comorbidities.

Objective:

Motivated by the success of acoustical color spectrographic techniques in other knowledge domains, we sought to build proof-of-concept systems for the computer-based color spectrographic analysis of respiratory sounds, recorded from various sites.

Methods:

We used a USB miniature electret microphone and a Windows-based color spectrographic analysis package to obtain color spectrograms for breath sound recordings from the neck, from an oxygen mask, from the ear canal, and from a leak-free microphone pneumatically connected to the cuff of a laryngeal mask airway.

Results:

Potentially useful color spectrographic displays were obtained from all four recording sites, although the spectrograms obtained varied in their characteristics. It was also found that obtaining high-quality color spectrograms requires attention to a number of technical details.

Conclusion:

Color spectrographic analysis of respiratory sounds is a promising future technology for respiratory monitoring.

Keywords: Bio-acoustics, Breath sounds, Color spectrograms, Electronic sound analysis, Respiratory monitoring, Pain management.


1. INTRODUCTION

The need for reliable respiratory monitoring has existed since antiquity, but this need has become especially pressing in recent years with the frequent use of opioids for perioperative pain management and an increased prevalence of patients suffering from respiratory comorbidities, such as sleep apnea [1-5].

Given this crucial need, efforts at developing a simple, dependable method of continuous respiratory monitoring have been ongoing for a great many decades. Early efforts were based on direct visual observation of chest and abdominal movements as well as observing signs, such as nasal flaring, or the use of the accessory muscles of respiration. Later, with the invention of stethoscope, simple acoustical methods of respiratory assessment became available to the clinical community. With the subsequent invention of electronic amplification, a variety of new technologies became available, including respiratory monitoring belts placed on the chest and abdomen [6-9], nasal pressure methods [10, 11], nasal / oral thermistor methods [12, 13] (the thermistor warms up with expired gases), nasal / oral capnography [14, 15], extraction of respiratory information from the photoplethysmograph signal [16, 17], and electrical impedance methods based on a small injected electrical current [18, 19].

Out of these respiratory monitoring methods, capnography is amongst the most common and clinically used for continuous respiratory monitoring but suffers from a need to continually ensure that the gas sampling system is operating correctly [20]. Extraction of respiratory information from the pulse oximeter photoplethysmograph signal remains a field of active research [21] but has not yet come into the mainstream. A device known as ExSpiron 1Xi operates by detecting electrical impedance changes in the thorax and respiratory muscles and seems to be particularly promising [22], but is neither simple nor inexpensive.

One possible technology for continuous respiratory monitoring, that has interested the author for some time, is the use of color spectrographic analysis of respiratory sounds. Motivated by the success of color spectrographic techniques in the diagnostic monitoring of rotating machinery [23] and the analysis of bird calls [24], the author set about to build his own system for the color spectrographic analysis of respiratory sounds.

2. MATERIALS AND METHODS

2.1. Technique

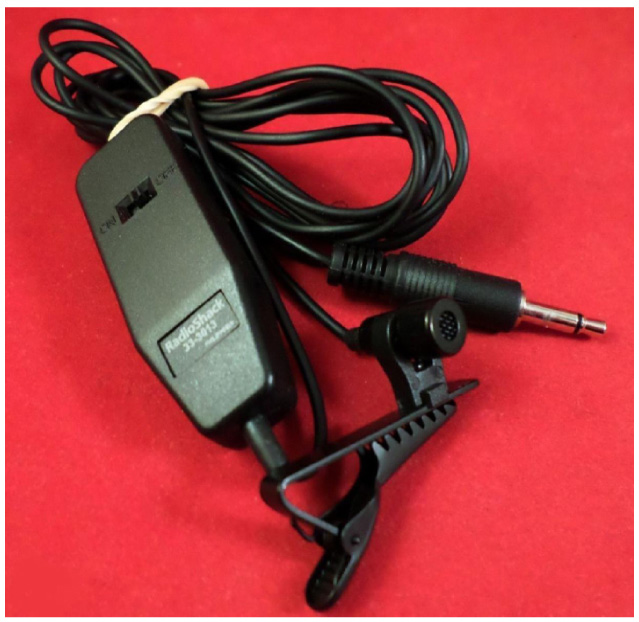
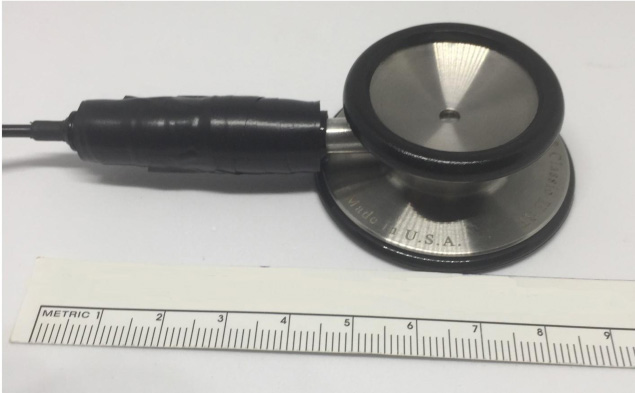
Much of the earlier work at our laboratory utilized a battery-operated RadioShack 33-3013 miniature omnidirectional electret microphone Fig. (1) secured to a stethoscope head (or another device) via a short piece of tubing (Fig. 2) and then amplified using an ordinary audio amplifier, such as a RadioShack miniature audio amplifier (Catalog # 2771008). Following amplification, the signal is then fed to the “line input” of the host computer for further signal processing.

Fig. (1). Early work at our laboratory utilized a RadioShack 33-3013 miniature omnidirectional electret microphone. This device uses a 1.5-volt LR44 button battery to power the unit. More recent projects have employed a USB microphone with a built-in amplifier, an example being the unit shown in (Fig. 3).

Fig. (2). Miniature omnidirectional electret microphone, such as that shown in (Fig. 1), secured to a stethoscope head via a short piece of tubing to allow breath sound recordings from the neck or chest. The same arrangement can also be used for obtaining heart-sound recordings.

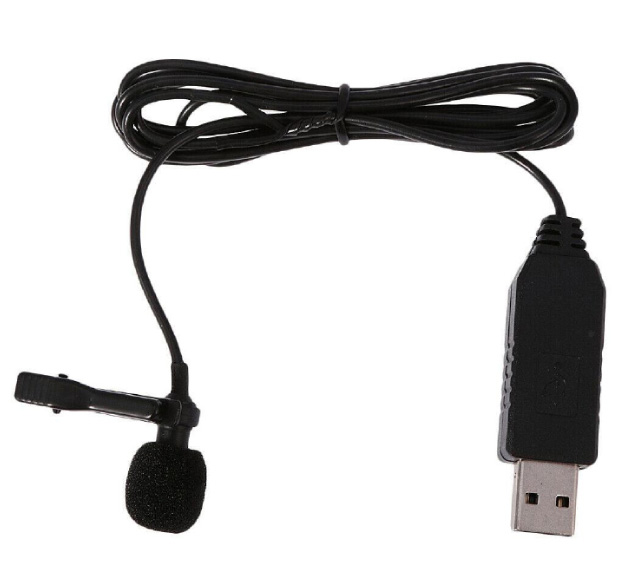
While this arrangement works well, the recent commercial availability of USB-connected miniature electret microphones (Fig. 3) has made it even easier to obtain quality bio-acoustical recordings. This is because USB microphones require no built-in battery (it obtains its power instead from the USB connection) and contains an internal amplifier as well. An additional advantage of USB type microphones is that the final signal obtained does not depend on the characteristics of the analog and digital circuitry within the host computer. One potential disadvantage, however, is the lack of a gain adjustment control in the built-in amplifier in most USB type microphones.

Fig. (3). This miniature electret microphone, with an integral USB 2.0 interface, was purchased on eBay for under $7.00, including shipping (https://www.ebay.com/itm/Mini-Clip-on-USB-Lavalier-Lapel-Condenser-Microphone-Mic-for-PC-Internet-DIY/223411911450). When used for bio-acoustics work, the lapel clip and the foam microphone cover were not used.

For time-domain digital signal processing software, we have been using a free software program known as Audacity, an open-source digital audio editor and recording application package available for the Windows, macOS/OS X, and Linux operating systems. The program can be downloaded at https://www.audacityteam.org. Three special features of this program are likely to interest bio-acoustics investigators [1]: an Amplify feature that scales the signal [2], a Normalize feature that “normalizes” the signal to a chosen maximum amplitude (e.g., 0 dB), and [3] three digital filtering options (Low Pass Filter, High-Pass Filter and Notch Filter). However, many other excellent free audio software packages are also available - for a comprehensive list visit https:// en.wikipedia.org/ wiki/ Comparison_of_free_software_for_audio.

Fig. (4). Screen capture from a color spectrogram program Spectrogram16, when presented with 1000 Hz 94 dB SPL sinusoidal calibration tone via the USB 2.0 microphone shown in (Fig. 3). Note the straight line at 1 kHz. A slider on the right-hand side of the screen controls the microphone sensitivity; as the microphone sensitivity is increased, the effects of ambient room noise become increasingly apparent. This free program is available at https://auditoryneuroscience.com/sites/default/files/gram16_setup.zip.

Fig. (5). Screen capture from a color spectrogram JavaScript app when presented with 1000 Hz 94 dB SPL sinusoidal calibration tone via the USB microphone shown in (Fig. 3). Note the straight red line at 1 kHz. This app is available at https://auditoryneuroscience.com/acoustics/spectrogram.

Fig. (6). A sample neck recording of breath sounds presented in the time-domain using the Audacity program (top, in yellow) as well as presented in the corresponding frequency-domain using a color spectrogram obtained using the Spectrogram16 program (bottom).

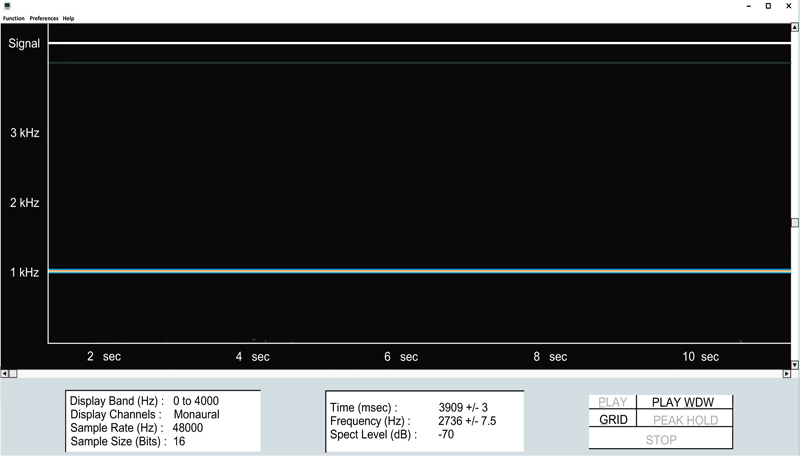
For color spectrogram digital signal processing software, we have primarily been using a Windows program called Spectrgram16 (Fig. 4), available as a free download at https://auditoryneuroscience.com/sites/default/files/gram16_setup.zip.

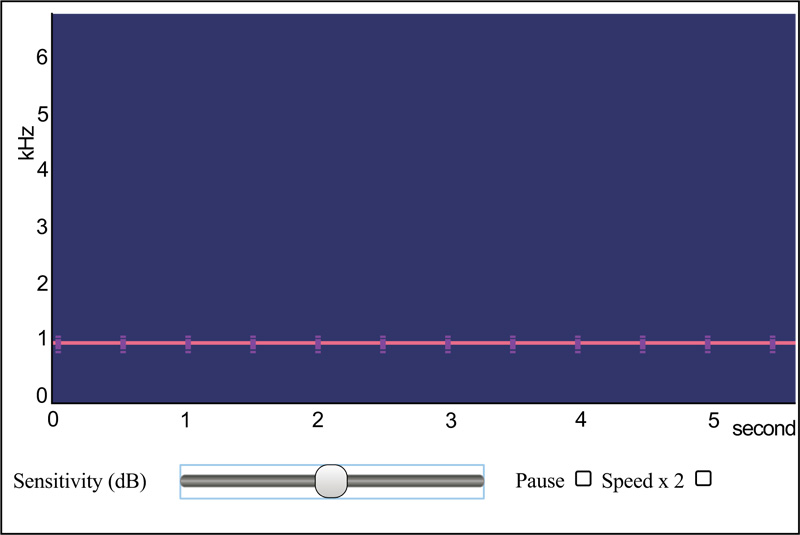
Another color spectrogram program (a Web-based JavaScript app) that may interest researchers is available at https://auditoryneuroscience.com/acoustics/spectrogram (Fig. 5). This program has the advantage that it does not require to be downloaded and installed, but suffers from the disadvantage that it does not work with all Web browsers.

With this background, let us consider a series of projects that were initiated to explore the potential value of displaying color spectrograms for breath sound recordings.

3. PROJECTS

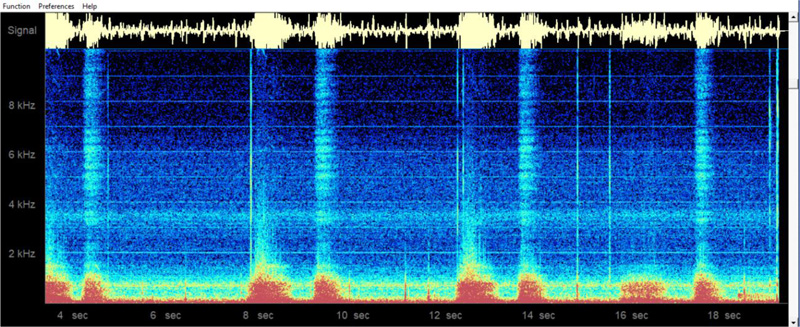
The first project sought to obtain color spectrograms for breath sound recordings from the neck. This recording location offers an important advantage over recording from commonly used sites, like the anterior chest wall, in that respiratory sounds recordings from the neck are generally not contaminated by heart sounds.

Fig. (6) shows a sample neck recording in the time-domain as well as the corresponding frequency-domain color spectrogram. The Masimo Acoustic Respiration Rate (RRa) monitor similarly provides a non-invasive continuous monitoring of respiration rate via a neck acoustic transducer [25-28], although their proprietary system does not offer an analog acoustic signal for user scrutiny or for computer analysis, and nor does it offer any form of color spectrogram analysis. Additionally, the potential value of recording breath sounds from the neck can be seen from reports of tracheal sound recordings being helpful in detecting apnea in patients recovering from anesthesia [29], as well as useful in other clinical settings [30, 31].

Fig. (7). A miniature electret microphone can be embedded into an oxygen mask to detect respiratory sounds. The amplified signal is then fed into a color spectrogram program to produce a display such as that shown above. The range of frequencies displayed is 0 Hz to 6000 Hz, with the highest frequency signal components at the top and the lowest at the bottom. Red areas indicate strongest signal levels, blue areas the weakest nonzero levels: BLACK < BLUE < GREEN < YELLOW < RED. Note that both inspiration and expiration are clearly visible. (First place winner, Society for Technology in Anesthesia 2010 Engineering Design Contest, awarded for a novel respiratory monitor based on bioacoustics.)

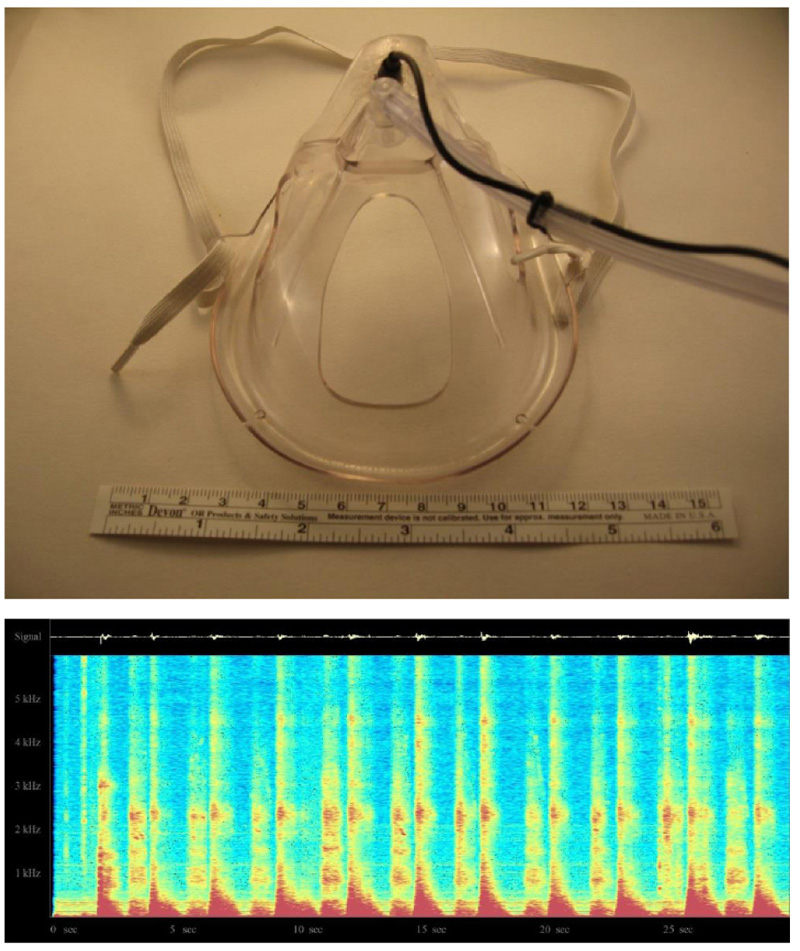
The second project sought to embed a microphone into an oxygen mask to record respiratory sounds (Fig. 7, top). As before, the amplified signal was fed into the color spectrogram program, spectrogram16.exe, to produce a display such as that shown in Fig. (7). Again, note that both inspiration and expiration are clearly visible.

Fig. (8). Placing a miniature electret microphone in a test subject’s ear canal can be used as a means of color spectrographic respiratory monitoring, although the pattern is less distinctive compared to that shown in Fig. (7). In this case, the microphone was modified with the addition of an adapter to allow it to be placed comfortably in the external ear canal. The middle image shows a color spectrogram obtained for 30 seconds of nasal breathing; note that inspiration is more evident than expiration. The range of frequencies displayed is 500 Hz to 2000 Hz, with the highest frequency signal components at the top and the lowest at the bottom. Red areas indicate strongest signal levels, blue areas the weakest non-zero levels: BLACK < BLUE < GREEN < YELLOW < RED. The bottom panel shows a 30 second period of mouth breathing interrupted by a period of deliberate apnea. Notice the larger than usual inspiration following the apnea period. In this recording, as well as that of Figs. (6) and (7), the experimental subject was the author. (Presented at the 16th World Congress of Anaesthesiologists (WCA) 2016 https:// f1000research.com/ posters/ 5-2300.)

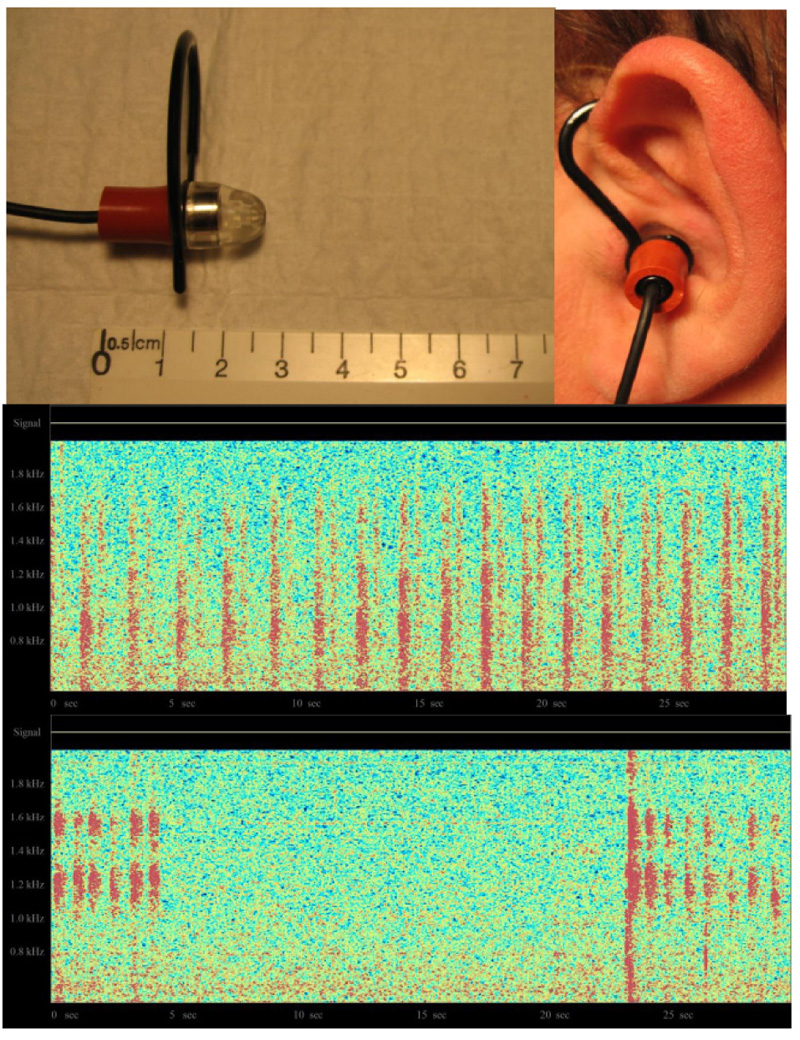
The third project sought to record respiratory sounds from the ear canal. In this case, a miniature electret microphone was modified with the addition of an adapter to allow it to be placed comfortably in the external ear canal. The amplified signal was once again connected to a real-time color spectrogram program. The top of Fig. (8) shows the modified microphone assembly, while the bottom shows the obtained respiratory acoustic spectrograms, under two different conditions.

Fig. (9). Illustration of how one can transduce breath sounds from a Laryngeal Mask Airway, in this case, an LMA Unique. The system employs a microminiature electret microphone embedded in a shortened 3-ml or 5-ml plastic syringe with a Luer lock end and placed in the cuff inflation line after cuff inflation. Epoxy glue is used to hermetically secure the microphone into the barrel of the syringe so as to prevent any leaks. (The LMA cuff is typically inflated to a pressure of around 20 mmHg.)

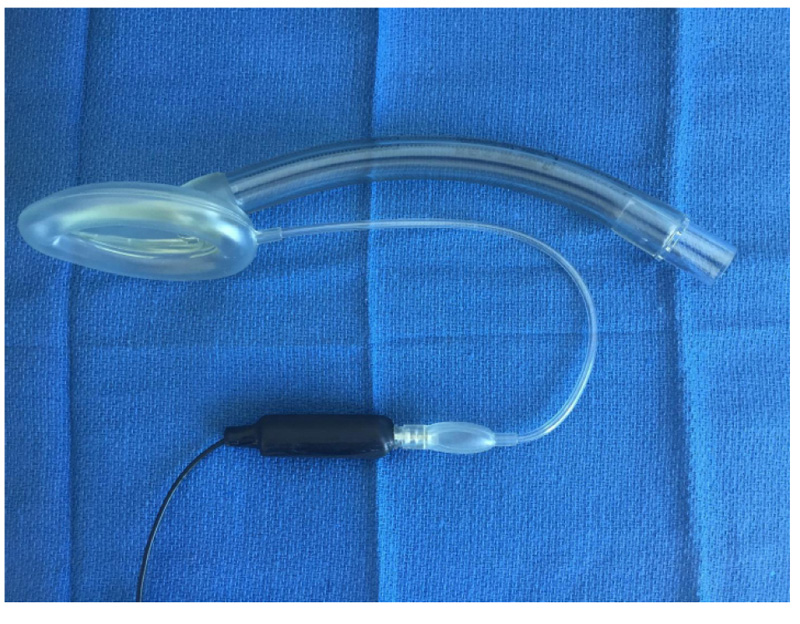
The final project was to add a special microphone to a Laryngeal Mask Airway (LMA) using a custom-built leak-free microphone assembly based on a miniature electric microphone (Radio Shack 30-3013, Radio Shack, Fort Worth, TX). This microphone was embedded in a shortened 3-ml plastic syringe with a Luer lock end and epoxy glue was used to hermetically secure the microphone into the barrel of the syringe (Fig. 9). A high-gain monaural audio amplifier (Radio Shack Mini Audio Amplifier/ Speaker 2771008) was then used to amplify the microphone signal for use with a headset or for computer analysis [32].

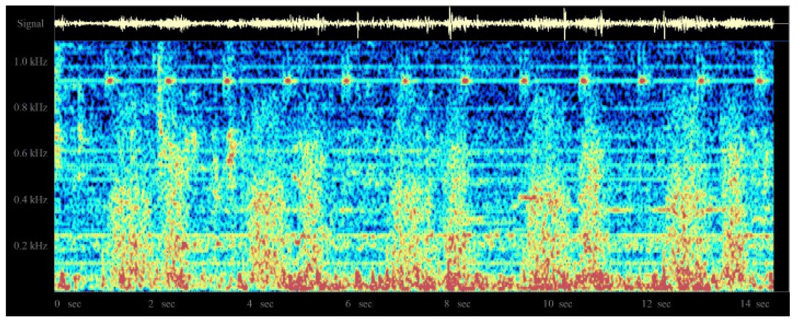
In an earlier study [32], the system was evaluated by the author in 10 patients under general anesthesia, using the classic LMA, with patients undergoing spontaneous ventilation. In these cases, clearly identifiable regular breath sounds were obtained, although in one patient who developed partial airway obstruction with the LMA in situ, the sounds become chaotic, irregular, and intense. A sample normal audio recording may be downloaded at http://lmamonitor.homestead.com. Fig. (10) shows the color spectrogram display from this recording obtained using the free Windows spectrogram program spectrogram16.exe.

Fig. (10). Sample color spectrogram display of breath sounds obtained when recording from the cuff of a Laryngeal Mask Airway, using the special custom-built leak-free electret microphone shown in Fig. (9). The raw sounds can be heard at http://lmamonitor.homestead.com. The spectrogram program used was spectrogram16.exe. The range of frequencies displayed is 0 Hz to just over 1000 Hz, with the highest frequency signal components at the top and the lowest at the bottom. Red areas indicate strongest signal levels, blue areas the weakest non-zero levels: BLACK < BLUE < GREEN < YELLOW < RED. Note that both inspiration and expiration are clearly visible, as well as the repetitive beep from the pulse oximeter at around 915 Hz.

4. RESULTS AND DISCUSSION

A color spectrogram is a plot of the frequency components of a signal against time, with the signal intensity encoded as a color. In the images shown, red areas indicate strongest signal levels, while blue areas are the weakest non-zero signal points: BLACK < BLUE < GREEN < YELLOW < RED.

Several ideas for recording breath sounds were explored in this paper, with the focus on exploring various locations on the body as acoustic recording sites for use in color spectrographic analysis. The expected value of these efforts is that with experience, clinicians will be able to interpret the obtained raw sounds and corresponding color spectrograms to assist in the detection of various normal and pathologic states. These include normal breathing, tachypnea, phonation, partial airway obstruction, wheezing, and ventilation leaks with positive pressure ventilation. It is further envisioned that the real-time display of color spectrogram breathing patterns, locally or at a central monitoring station, may eventually turn out to be a useful means of remote respiratory monitoring in patients at an increased risk of respiratory depression.

Fig. (11). Screenshot image showing the various signal processing parameters for the Spectrogram16 program when used in “manual” mode. Note that the choice of these parameters will greatly influence the characteristics of the color spectrogram display. In the case of the images displayed in Fig. (12), the high band limit was set to 1200 Hz rather than the 4000 Hz displayed in this image, as most of the interesting portions of the spectrogram in this instance are below 1200 Hz. The Scroll Control Width parameter determines the time-resolution of the displayed spectrogram, while the two Spectrum Level controls, along with the signal amplitude control scroll bar (Fig. 12), allow the user to control the sensitivity of the system.

Fig. (12). Illustration of the effect of changing the signal amplitude control scroll bar in the Spectrogram16 program. Top: Signal amplitude control set to around one-third of full scale. Bottom: Signal amplitude control increased to a little over one-half of the full scale. In both cases, the acoustic signal under evaluation is the recording from a Laryngeal Mask Airway (LMA), as shown earlier in Fig. (10). Note also that the image in Fig. (10) is taken with even more sensitivity than shown here.

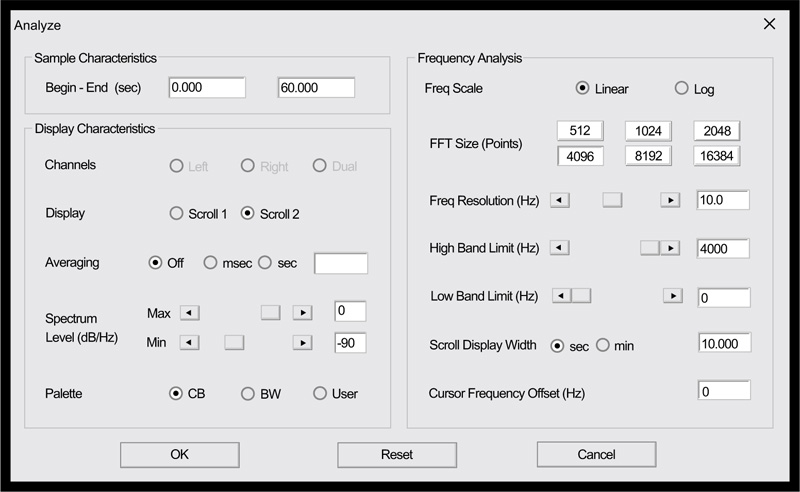
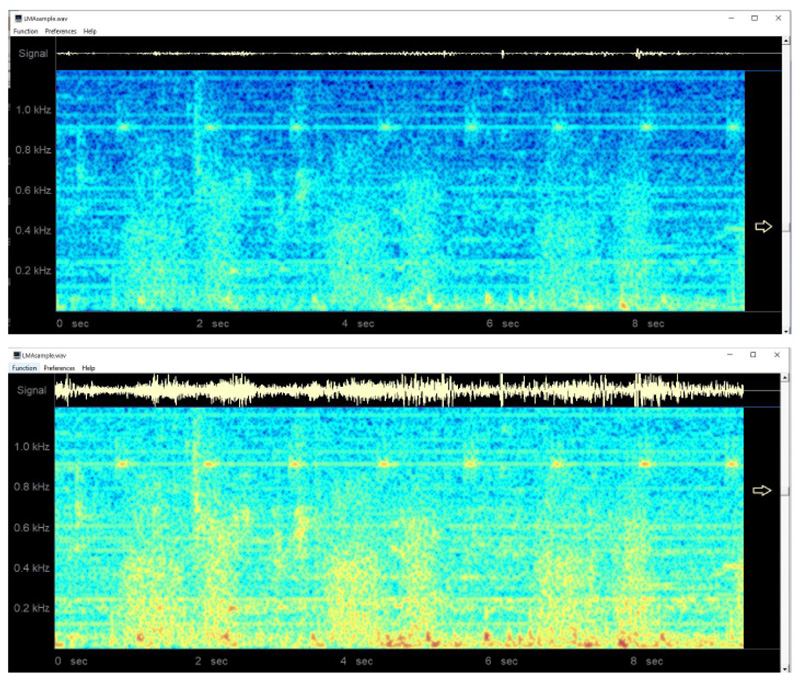
Clinicians who would like to explore the possibilities offered by this nascent technology will likely find that the method is remarkably straight-forward, with only a minimal knowledge of audio recording methods being necessary. That being said, obtaining high-quality color spectrograms for respiratory acoustic data requires attention to a number of technical details. These include the various parameters that are shown in Fig. (11), taken from the spectrogram16 program, as well as appropriately adjusting the system sensitivity ( Fig. 12).

It should also be noted that there are several iPhone and Android apps that produce color spectrograms, in case one wants to avoid using a Windows computer as a computing platform.

Finally, note that the results obtained here, while clearly preliminary in nature by virtue of being a proof-of-concept undertaking, suggest a variety of avenues for possible future studies. These studies might include developing methods to show how color spectrograms might best be processed to reliably detect apnea, snoring or otherwise disordered breathing, to measure the respiratory rate or estimate breath-by-breath tidal volumes. Computer algorithms aimed at filling these needs would likely need to account for interindividual differences in breath sounds and the presence of background noise in the signals.

CONCLUSION

The proof-of-concept spectrographic displays of respiratory sounds, obtained from various sites, suggest that acoustical color spectrographic analysis is a promising future technology for respiratory monitoring.

NOTES

CONSENT FOR PUBLICATION

Not applicable.

AVAILABILITY OF DATA AND MATERIALS

Not applicable.

FUNDING

Funding for this project was entirely from departmental and personal sources.

CONFLICTS OF INTEREST

The author declares that he has no conflicts of interest, financial or otherwise.

ACKNOWLEDGEMENTS

This article is a greatly expanded version of a newsletter contribution available online at: https:// society-for-airway-management.dcatalog.com/ v/ SUMMER-2018-AIRWAY-GAZETTE.

REFERENCES

[1] Jungquist CR, Smith K, Nicely KL, Polomano RC. Monitoring hospitalized adult patients for opioid-induced sedation and respiratory depression. Am J Nurs 2017; 117(3)(Suppl. 1): S27-35.
[2] Lee LA, Caplan RA, Stephens LS, et al. Postoperative opioid-induced respiratory depression: A closed claims analysis. Anesthesiology 2015; 122(3): 659-65.
[3] Correa D, Farney RJ, Chung F, Prasad A, Lam D, Wong J. Chronic opioid use and central sleep apnea: A review of the prevalence, mechanisms, and perioperative considerations. Anesth Analg 2015; 120(6): 1273-85.
[4] Voscopoulos C, Theos K, Tillmann Hein HA, George E. A risk stratification algorithm using non-invasive respiratory volume monitoring to improve safety when using post-operative opioids in the PACU. J Clin Monit Comput 2017; 31(2): 417-26.
[5] Phillips SN, Fernando R, Girard T. Parenteral opioid analgesia: Does it still have a role? Best Pract Res Clin Anaesthesiol 2017; 31(1): 3-14.
[6] Rahman T, Page R, Page C, Bonnefoy JR, Cox T, Shaffer TH. pneuRIPTM: A novel respiratory inductance plethysmography monitor. J Med Device 2017; 11(1): 0110101-6.
[7] Bhaskar A, Subramani S, Ojha R. Respiratory belt transducer constructed using a singing greeting card beeper. Adv Physiol Educ 2013; 37(1): 117-8.
[8] Retory Y, Niedzialkowski P, de Picciotto C, Bonay M, Petitjean M. New Respiratory Inductive Plethysmography (rip) method for evaluating ventilatory adaptation during mild physical activities. PLoS One 2016; 11(3): e0151983.
[9] Mandel JE, Atkins JH. Hilbert-huang transform yields improved minute volume estimates from respiratory inductance plethysmography during transitions to paradoxical breathing. Anesth Analg 2016; 122(1): 126-31.
[10] Urner LM, Kohler M, Bloch KE. Automatic processing of nasal pressure recordings to derive continuous side-selective nasal airflow and conductance. Front Physiol 2019; 9: 1814.
[11] Thurnheer R, Bloch KE. Monitoring nasal conductance by bilateral nasal cannula pressure transducers. Physiol Meas 2004; 25(2): 577-84.
[12] Budhiraja R, Goodwin JL, Parthasarathy S, Quan SF. Comparison of nasal pressure transducer and thermistor for detection of respiratory events during polysomnography in children. Sleep 2005; 28(9): 1117-21.
[13] Lerman J, Feldman D, Feldman R, et al. Linshom respiratory monitoring device: A novel temperature-based respiratory monitor. Can J Anaesth 2016; 63(10): 1154-60.
[14] Rhoades C, Thomas F. Capnography: Beyond the numbers. Air Med J 2002; 21(2): 43-8.
[15] Friedrich-Rust M, Welte M, Welte C, et al. Capnographic monitoring of propofol-based sedation during colonoscopy. Endoscopy 2014; 46(3): 236-44.
[16] Touw HRW, Verheul MH, Tuinman PR, et al. Photoplethysmography respiratory rate monitoring in patients receiving procedural sedation and analgesia for upper gastrointestinal endoscopy. J Clin Monit Comput 2017; 31(4): 747-54.
[17] L’Her E, N’Guyen QT, Pateau V, Bodenes L, Lellouche F. Photoplethysmographic determination of the respiratory rate in acutely ill patients: Validation of a new algorithm and implementation into a biomedical device. Ann Intensive Care 2019; 9(1): 11.
[18] Ianchulev S, Ladd D, MacNabb CM, Qin L, Marengi N, Freeman J. Use of a respiratory volume monitor to assess respiratory competence in cardiac surgery patients after extubation. J Clin Med Res 2017; 9(1): 17-22.
[19] Voscopoulos CJ, MacNabb CM, Brayanov J, et al. The evaluation of a non-invasive respiratory volume monitor in surgical patients undergoing elective surgery with general anesthesia. J Clin Monit Comput 2015; 29(2): 223-30.
[20] Shankar KB, Kannan S. Prevention of occlusion of sampling tubes in side-steam capnographs. Can J Anaesth 1997; 44(4): 453.
[21] Nilsson LM. Respiration signals from photoplethysmography. Anesth Analg 2013; 117(4): 859-65.
[22] Ebert TJ, Middleton AH, Makhija N. Ventilation monitoring during moderate sedation in GI patients. J Clin Monit Comput 2017; 31(1): 53-7.
[23] Zhang Y. Zhang Y, Bingham C, Yang Z, Ling BW, Gallimore M. Machine fault detection by signal denoising with application to industrial gas turbines. Measurement, 2014; 58: 230-40.
[24] Meliza CD, Keen SC, Rubenstein DR. Pitch- and spectral-based dynamic time warping methods for comparing field recordings of harmonic avian vocalizations. J Acoust Soc Am 2013; 134(2): 1407-15.
[25] Ouchi K, Fujiwara S, Sugiyama K. Acoustic method respiratory rate monitoring is useful in patients under intravenous anesthesia. J Clin Monit Comput 2017; 31(1): 59-65.
[26] Ishikawa M, Namizato D, Sakamoto A. The value of acoustic respiratory rate monitoring in a patient with postoperative hemorrhage after thyroidectomy: A case report. J Clin Monit Comput 2020; 34(1): 147-50.
[27] Suzuki T, Tsuda S, Nakae H, et al. Usefulness of acoustic monitoring of respiratory rate in patients undergoing endoscopic submucosal dissection. Gastroenterol Res Pract 2016; 2016.2964581
[28] Mimoz O, Benard T, Gaucher A, Frasca D, Debaene B. Accuracy of respiratory rate monitoring using a non-invasive acoustic method after general anaesthesia. Br J Anaesth 2012; 108(5): 872-5.
[29] Liu J, Ai C, Zhang B, et al. Tracheal sounds accurately detect apnea in patients recovering from anesthesia. J Clin Monit Comput 2019; 33(3): 437-44.
[30] Nakano H, Hayashi M, Ohshima E, Nishikata N, Shinohara T. Validation of a new system of tracheal sound analysis for the diagnosis of sleep apnea-hypopnea syndrome. Sleep 2004; 27(5): 951-7.
[31] Nakano H, Furukawa T, Tanigawa T. Tracheal sound analysis using a deep neural network to detect sleep apnea. J Clin Sleep Med 2019; 15(8): 1125-33.
[32] John Doyle D. The laryngeal mask airway audio monitor. Obtaining breath sounds from the laryngeal mask airway: A new device for patient monitoring. Anesthesiology 2003; 99(1): 242.